7. Modelling Requirements
In all cases you must think: what information do I need to build a system, how can I get this information, and how can I disseminate this information into the software engineering process, once acquired?
– Anon
There are some kinds of requirements documentation techniques that can be applied to the software development task. While the following is not a complete list, it does outline the kind of techniques that are often used and which normally provide adequate feedback from users. The conscientious UX analysts, however, should not rely only on these methods but should also include ones from the research literature such that a greater depth of understanding can be derived. In any case, the following list gives a subset of common techniques that both the UX analysts and the software engineer should know and understand.
7.1 Informal Methods
The most common representation medium for informal systems is natural language; this is the case across organisations and across representational contexts. Forms are represented in natural language as are letters, memos, procedural documentation, and the like. Further, scenarios are often represented in natural language, and interviews with users and participants within the system’s creation process are also conducted using natural language. Therefore, an analysis of the language used within these kinds of artefacts is eminently useful for requirements elicitation purposes. Practical methods of understanding requirements from a natural language analysis are by the use of nouns and verbs to represent actions and functionality. We can see that from an analysis of natural language, constraints, targets, owners, and actors can also be identified. Additional aspects of the functionality, which may be missed in general question-and-answer sessions with users, become self-evident when natural language analysis is applied to transcripts. In this case, the UX’er should think about understand the types of actions that are required and the interrelationships between those actions in a way that does not require the user to make changes in how they are discussing the requirements - and informal methods are very useful for this.
7.1.1 User Stories
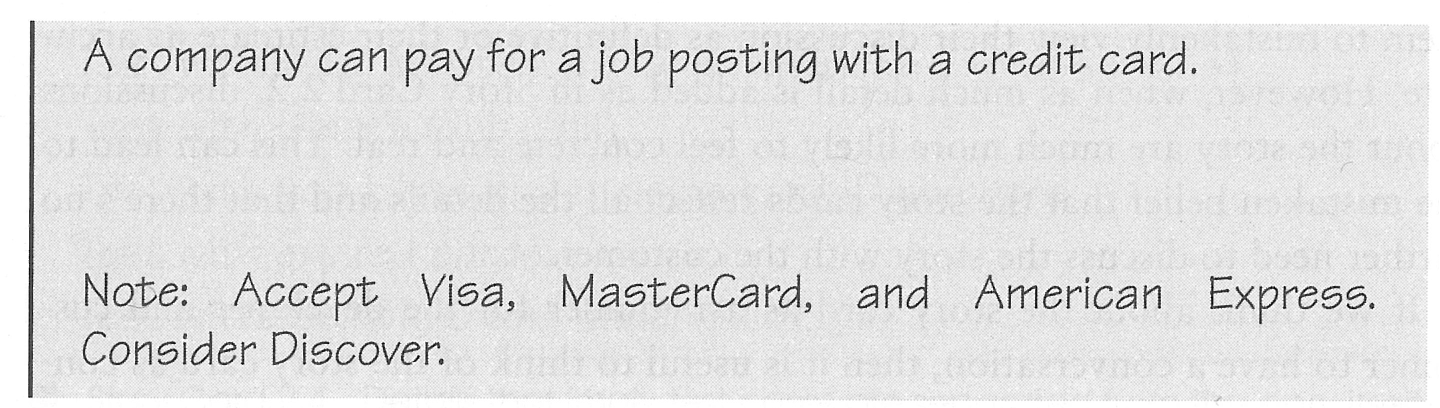
User stories simply describe functionality that will be available to the users of the system [Cohn, 2004]. They are comprised of a written description, conversations about the story, details of the story, and a series of tests that enable us to understand if the document is complete and, therefore, the story is an accurate representation of the desired user experiences. User stories can be varying lengths, and these are determined by the way in which the story is created and summarised and also based on the purpose for which it is intended. In some cases, it can be the size of a full A4 sheet and for others it can fit onto two sides of a standard index filing card (see Figure: Story Card with Notes).
The story is the visible part with the background information, which relates to the conversation between the customer and the developer of the story, being one of the most important aspects. The stories are often prioritised based on the value to both the organisation and the needs of the users.
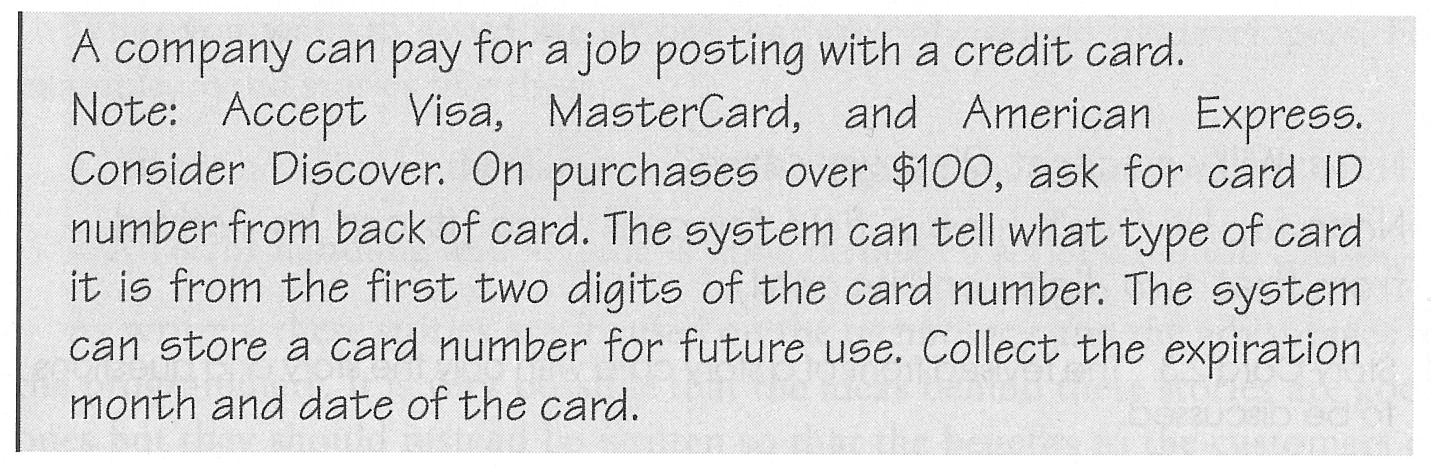
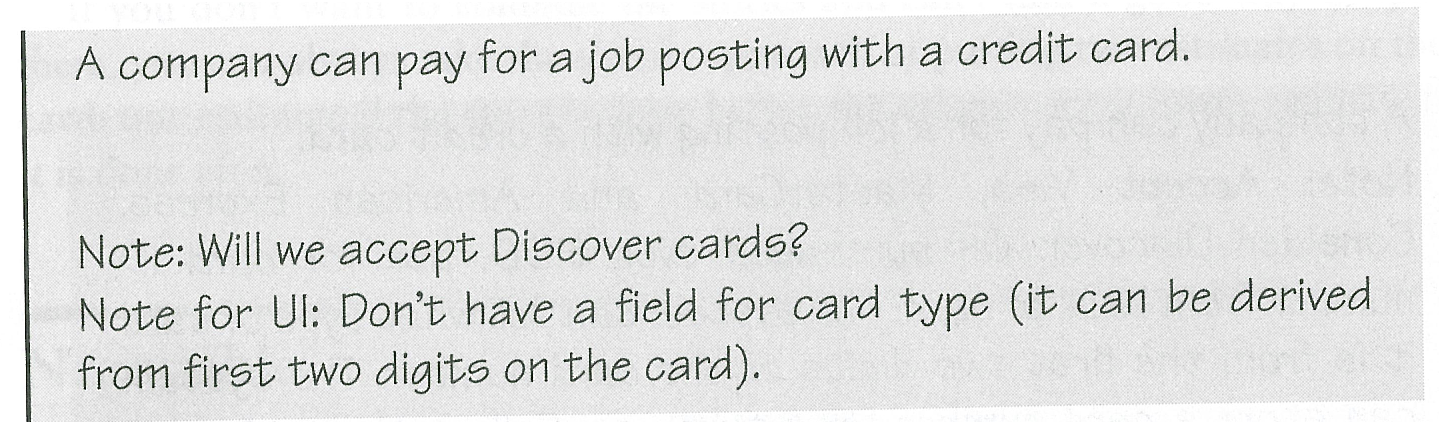
Stories should be independent in that references to other stories of the other examples should be removed. In this way, the simplicity of the work can be embraced, and the story becomes easily understandable, in this way, developers are not required to investigate complex cross-referencing to understand the primary message of a story. Stories should also be negotiable in that they should not be thought of as fixed contracts but can be altered or modified based on new information or a negotiation with other stakeholders of the story. Obviously the story should be valued by both the user and the customer, and, besides, the story should be estimate-able. This means that the amount of time required to create the functionality to enact the story can be easily gauged by the developer even based on the developers lack of domain or technical knowledge. This really suggests that the story should be small enough for its development to be easily quantified (see Figure: Story Card with Too Much Detail). Removing complexity also aids the estimate-ability of the work required to enact the story and so it may be useful to split stories into different parts to maintain their brevity (see Figure: Revised Story Card).
Finally, the story should be testable; some developers suggest that successfully passing these tests prove that the story has been successfully developed, however for the UX analyst this is nowhere near the level of support that is required to suggest that success has been achieved, and comprehensive summative post-testing should also be carried out.
7.1.2 Use Cases
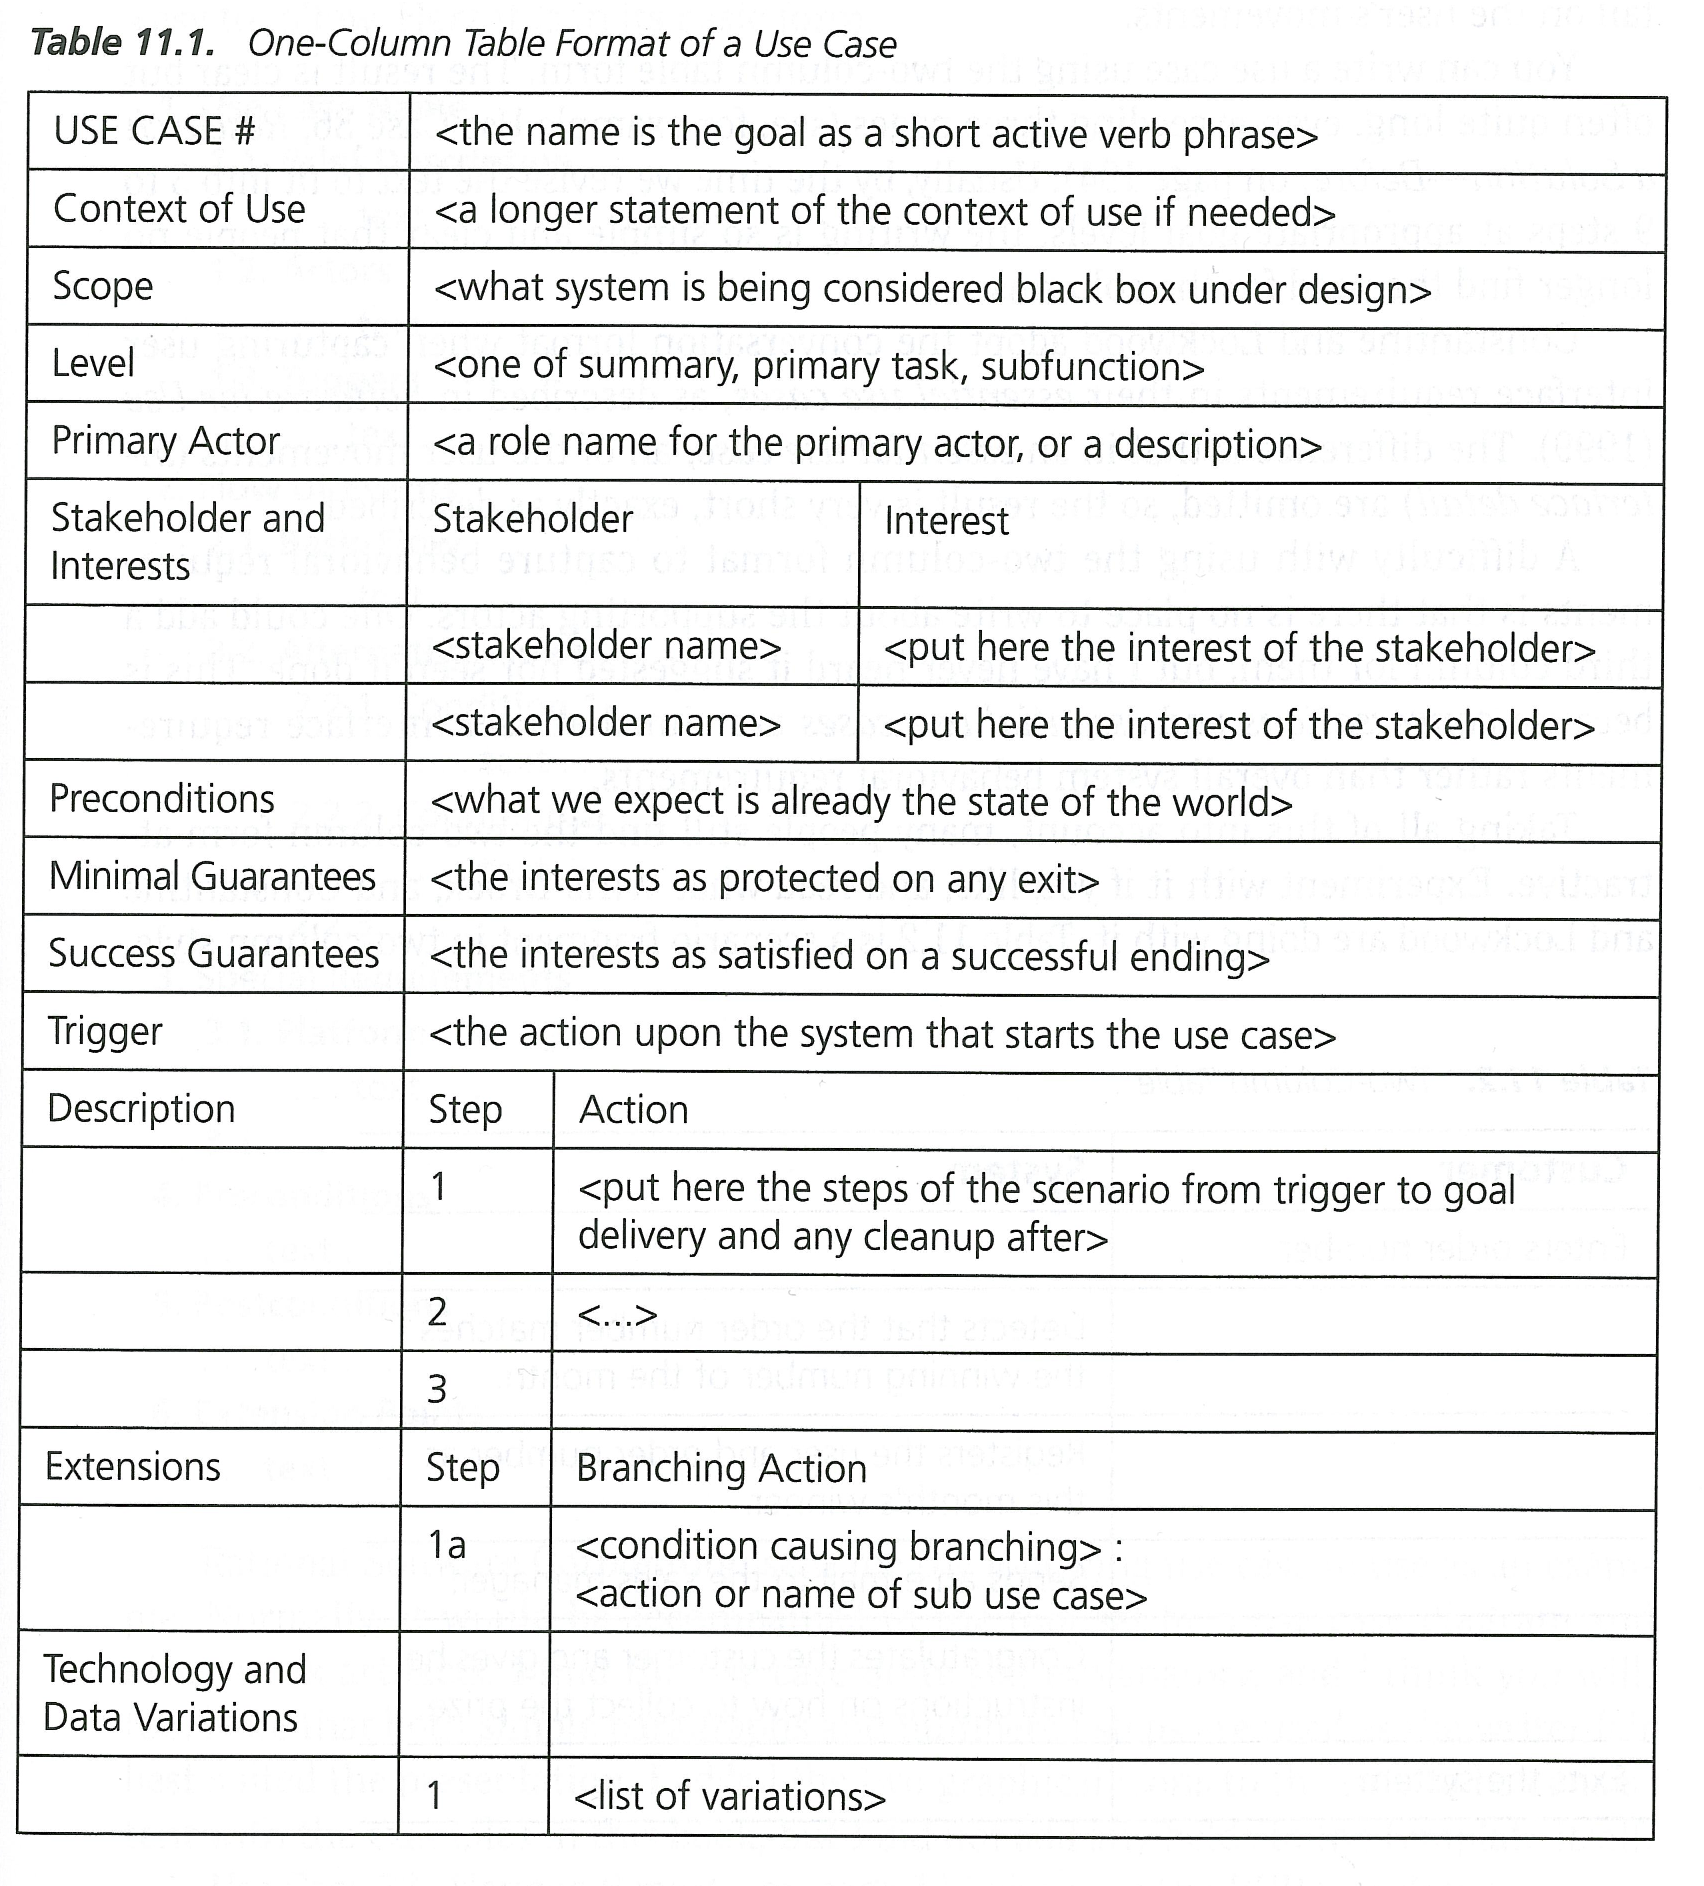
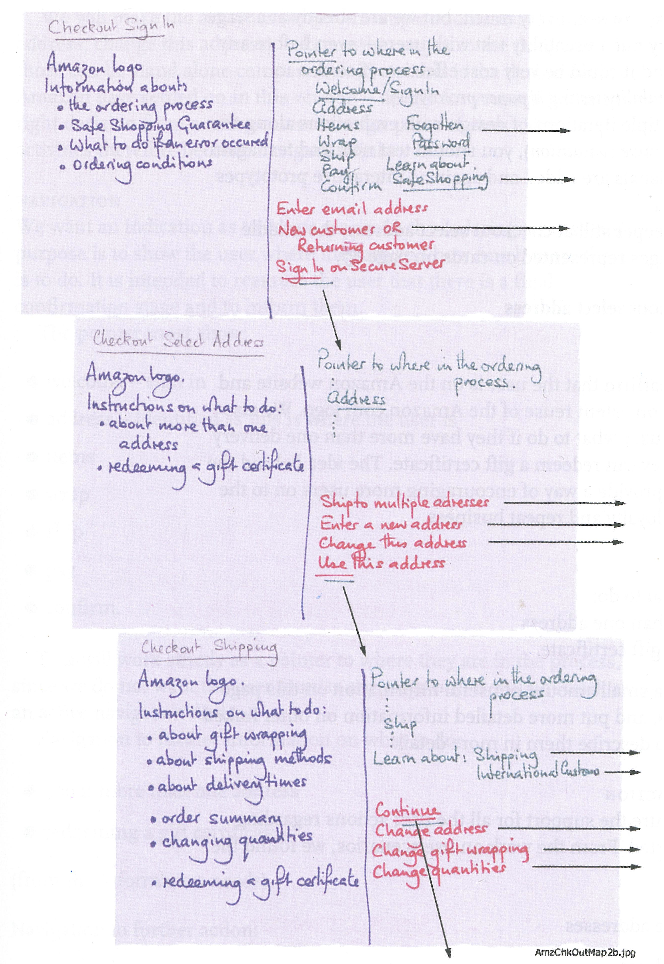
A use case differs from a user story because the user story is far less complex, shorter, and with an estimate-able outcome [Cockburn, 2001]. A use case describes a system under various conditions and forms an implicit contract between the developers of the system and the commissioners of that system about the behaviour it will exhibit. Within the context of human-computer interaction, we can see that use cases can be effective when focused on human behaviour and the interactive environment. Indeed, use cases can also be applied to non-user facing parts of the system that makes them more effective. In this case, a unified language is built up such that the software engineers understand the use cases regardless of whether they are created by the UX’er, business manager, organisation analyst, information analyst, knowledge analyst, or any other of the number of specialisms that are required to develop the system. Use cases can be created to fill many different purposes and may take many different forms. As long as the form is well understood and all use case creators are consistent then there should not be any problem regarding the uniformity of understanding which is transmitted via these cases. Mostly, however, use case will consist of: the primary initiator, for example, the purchaser, claimant, or user; the use cases scope; its level of importance; and a list of stakeholders who may also be interested. Often success scenarios are also listed, and possible extensions to the system can be discussed (see Figure: Tabular Use-Case). The thing to remember about use cases is that they really are a requirement and should not require translation into a secondary format. However, be warned, they do not account for all requirements such as business rules, data formats, etc. However in the case of the UX analyst they serve a perfectly adequate purpose for the necessity of specifying user-facing aspects of the system.
In addition to the standard aspects of the use case, other information can be added such as preconditions that describe how the system should be before a use case commences; triggers that will initiate that use case; and guarantees that the use case will actually have being enacted correctly at the end. Use cases make use of the common software engineering scenario. However, it is normally created as a series of steps or bullet points as opposed to the standard scenario that is often more conversational. There are many different styles of use case ranging from formal, through casual, through to different styles created for different software engineering methodologies such as the Rational Unified process. Use cases may also take the form of if-statements and include extensions to common diagrammatic methods such as the Unified Modelling Language. The advantage of using this kind of modelling is that a software engineer will be familiar with UML. Therefore, there is less chance of misinterpretation than if the engineer were required to learn a new formalism.
7.1.3 Personas and Scenarios
According to Lene Nielsen, “the persona method has developed from being a method for IT system development to being used in many other contexts, including the development of products, marketing, planning of communication, and service design. Despite the fact that the method has existed since the late 1990s, there is still no clear definition of what the method encompasses. A common understanding is that the persona is a description of a fictitious person, but whether this description is based on assumptions or data is not clear, and opinions also differ on what the persona description should cover.” [Nielsen, 2013]
7.1.3.1 Personas
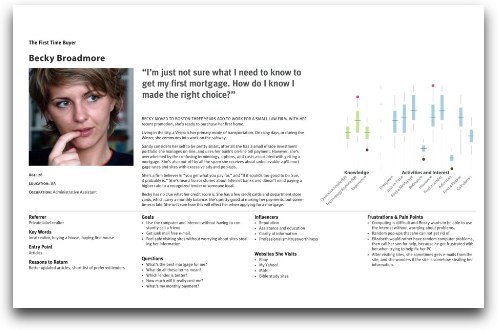
A Persona Is a fictional character created to convey a certain set of user properties and behaviours to a technical recipient, such as a software engineer (for example http://elderlypersonas.cure.at/). These personas are often created to flesh out the roles of actors, stakeholders, or proxies as we have discussed previously. In reality, personas are highly related to scenarios and user stories, however for a persona a set of user characteristics are created to describe the needs and requirements of that person13. In this case, a persona can be quite short, or very deep (see Figure: Expanded Persona) – and there is much discussion as to how best to create them and what properties they should have (Yahoo! have some nice approaches to Persona development14). Personas are often created by user experts, the users themselves, or key informants to place the technical expert into the role of the user, allow them to understand the user better, and to convey information that may be lost in the reduction often applied to other approaches.
7.1.3.2 Scenarios
A Scenario is a detailed description of the user’s interaction with the computer; these scenarios are not the same as those found in a use case because they are often larger and more encompassing than a use case, and are written in plain English as opposed to a bullet point. Within a standard scenario, there may be many actors within the system and many interrelated stories often criss-crossing throughout the scenario. This means that they do not conform to either the user story that requires there be a level of independence within the story or to the use cases because they do not separate out the stories into well-defined task requirements. In reality, a scenario represents a detailed definition of a specific instance of interactivity. Scenarios are very flexible and narrative in nature which means that they are easier to create than the more formalised user story or use case. Indeed, most scenarios are created from direct conversations with users and stakeholders of the system, and they are then transmitted for modelling without much additional modification. Often scenarios can be used to clarify issues and implications of system development when there is no other way to do so.
7.2 Semi-Formal Methods
Methods don’t neatly fit into informal and formal categories - there are of course semi-formal methods - and in reality most methods set on a spectrum. You can, however, decide where you think a method fits based on its reproducibility - and in the case of very formal methods their ability to generate code. The following methods sit on this border, but could of course fit into either; to a greater or lesser extent.
7.2.1 Wireframes
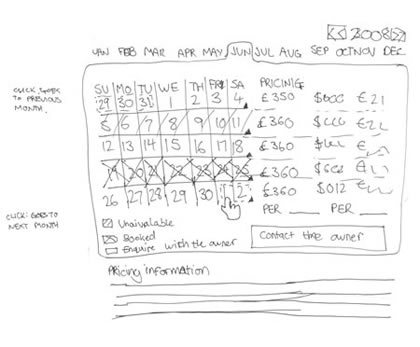
Wireframes are simple, often hand drawn, sketches of the proposed user interface (see Figure: Calendar Wireframe). In this case, wireframes can be created with the user at the time a requirements capture discussion is taking place so that the UX’er can make fast and direct corrections and developments to that interface – based on immediate feedback from the user. By drawing these wireframes freehand the technology barrier between the user and the UX’er are reduced, and there is a greater immediacy to the capturing of these requirements. Wireframes may also be annotated using bubbles and arrows that may normally point to interface components such they can be explained better.
As well as the immediacy of the hand drawn wireframe it is sometimes appropriate to create a computerised wireframe if this is being related to a different set of stakeholders, such as those responsible for the business requirements of an organisation – as opposed to the users directly – in reality this means for presentation to higher management.
7.2.2 Mock-ups & Storyboards
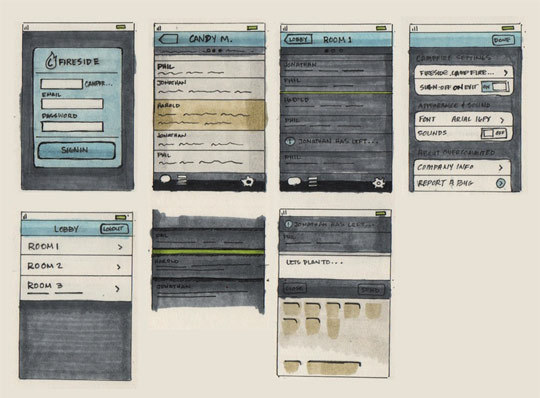
Mock-ups & Storyboards are just extensions of wireframes, but with more flesh on the bones. Again both mock-ups and storyboards may occur as hand drawn sketches, or as computer-generated interface elements. These mostly don’t have the ability to run real code – being presented mainly for their visual look and feel – indeed, both mainly sit between the wireframe and the ‘prototype’. As with wireframes, mockups are mostly a singular interface screen or component (or loosely-related series of screens) which can then be discussed (see Figure: iPhone Application Mock-up).
A storyboard (see Figure: Post-It Storyboard), on the other hand, adds interactive elements and interaction design to wireframes or mockups – showing the outcomes of certain user selections. These are mainly very simplistic interactions – being all that can be modelled with pen and paper – and do not run an interactive code. You often see a storyboard running top left to bottom right in a cartoon style, or in a flowchart-style whereby following different arrows has different effects.
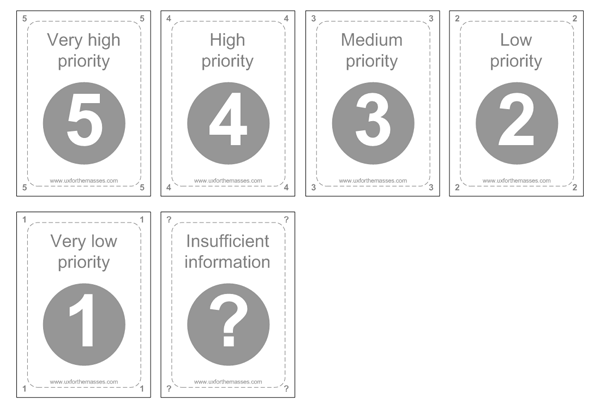
7.2.3 Priority Poker
Priority (Planning/Scrum Poker) Poker is a design game for collaboratively prioritising interface / UX specific items. Simply select the items that you think need to be prioritised and using a UX card deck (see Figure: Priority UX Poker Card Deck) for each person place your cards face down for each. Once there are no cards left, upturn and add them up, order the results gives the priority for development; highest first. You can then use these in an agile style MoSCoW prioritisation or MoSCoW15 analysis:
- M - MUST: Describes a requirement that must be satisfied in the final solution for the solution to be considered a success.
- S - SHOULD: Represents a high-priority item that should be included in the solution if it is possible. This is often a critical requirement but one that can be satisfied in other ways if strictly necessary.
- C - COULD: Describes a requirement that is considered desirable but not necessary. This will be included if time and resources permit.
- W - WON’T: Represents a requirement that stakeholders have agreed will not be implemented in a given release, but may be considered for the future. (note: occasionally the word “Would” is substituted for “Won’t” to give a clearer understanding of this choice)
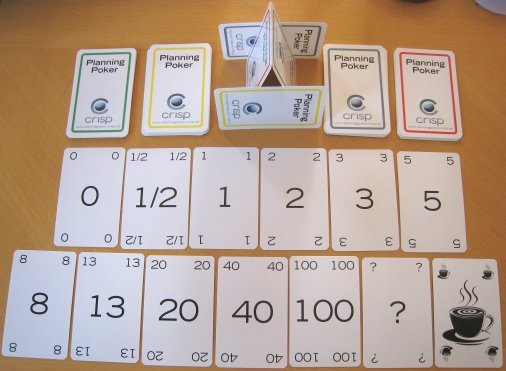
UX priority poker, is a variant of planning poker (see Figure: Priority UX Poker Card Deck), also called Scrum poker, and this is why it fit nicely into the MoSCoW, analysis model. Again, this is a consensus-based technique for estimating software development effort in user stories. As in priority poker, members of the group make estimates by playing numbered cards face-down to the table, instead of speaking them aloud. The cards are revealed, and the estimates are then discussed. By hiding the figures in this way, the group can avoid the cognitive bias of anchoring16. Neil Turner describes priority poker’s benefits in use as:
- During requirements gathering and analysis to prioritise goals and objects; functional and non-functional requirements; and to prioritise features.
- During design to prioritise personas, scenarios and user journeys.
- Following usability testing and expert reviews to priorities usability issues and recommended changes.
- During testing to prioritise bugs, defects and fixes.
- Within Agile projects to prioritise user stories and the product backlog.
7.3 Formal Methods
Software requirements are described in the standard IEEE 830-1998 as “A software requirements specification (SRS) is a complete description of the behaviour of the system to be developed. It includes a set of use cases that describe all of the interactions that the users will have with the software. Use cases are also known as functional requirements. In addition to using cases, the SRS also contains nonfunctional (or supplementary) requirements. Non-functional requirements are requirements that impose constraints on the design or implementation (such as performance requirements, quality standards, or design constraints).”
Within the context of modelling user requirements (requirement specification), our choices of methodology become limited. Some elicitation practices such as user stories and use cases have an endpoint that includes the specification of requirements and the modelling of the user-facing aspects of the system. However, this is not the case for all requirements elicitation processes and indeed, even for those who include their own specification, it may be necessary to translate from these to a format that is more readily understandable by a software engineer. In this case we will study modelling languages based on well-understood engineering techniques and focusing on the universal modelling language, state transition diagrams, and flow diagrams: flow charts, data flow diagrams and control flow diagrams.
7.3.1 Flowcharts
Flowcharts, and diagrams that describe the flow of actions, control, and information are an old, tried, and trusted form of conveying information about the way the system should behave concerning its users and the processes that those users enact [Loucopoulos and Karakostas, 1995]. While the flowchart has some detractors and is seen by some as an old form of modelling, you can guarantee that an examination of any whiteboard in any software engineering company will most likely have flow charting components written upon it. A flowchart is a common type of diagram and represents the system behaviour as a series of boxes with inter-connecting arrows indicating transitions between steps. These boxes have a specific order, and each one has a specific shape such that a certain action can be described; for example a diamond-shaped box represents a choice to be made, a cylinder represents a data storage device, etc. Each box has text written within it which describes either the process, choice, or artefact. Flow is represented by the adjoining arrows, and there may be return flows as well as standard waterfall type cascades. Flowcharts are used in analysing, designing, documenting or managing a process or program in various fields (see Figure: Data Flow Model). In addition to the standard flowchart, there are two types of diagrams which the HCI analyst or software engineer should be familiar with and these are the data flow diagram and the control flow diagram.
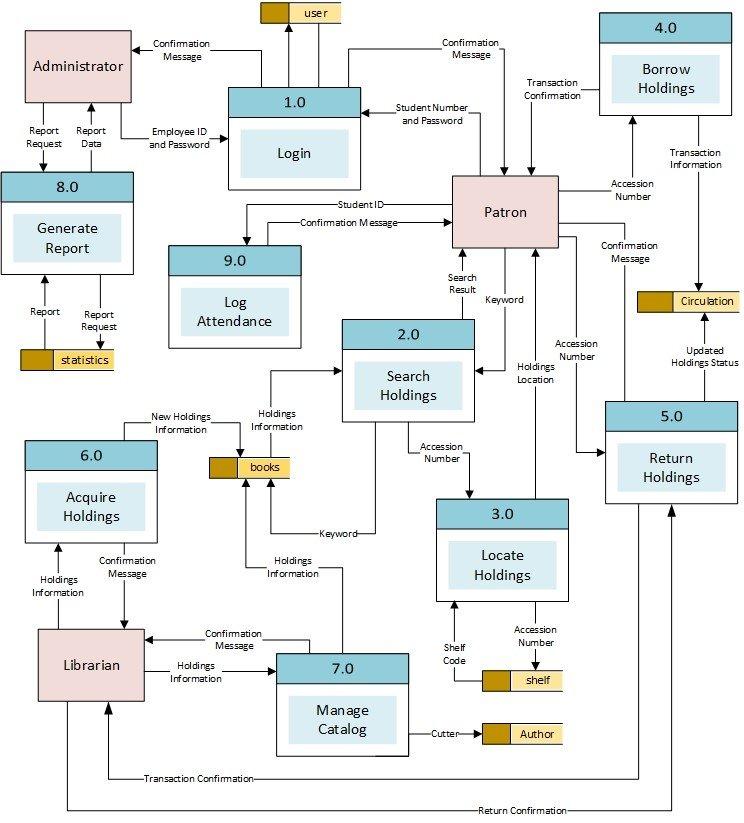
The data flow diagram (or model) is instrumental in the waterfall-based SSADM methodology and represents the flow of data through an information system in a graphical format. In this way, the data processing aspects of the system can be better understood, and a detailed analysis of the way information moves around the system, including its storage, can be derived. This is important for the UX’er because an understanding of how information moves, along with the kind of information that will be required by the system, indicates the type of inputs that will be required from the interface and thereby implies a certain interaction and behaviour that will be exhibited by the user. The data flow diagram provides no information about the timing or ordering of processors, or whether processes will operate in sequential or parallel, this differentiates it from a standard flowchart.
The control flow diagram represents a sequence of subdivided steps often representing well-known programming concepts such as if-then-else conditions, repetition, and/or case conditions. Annotated boxes and shapes are used to represent operations, data, or equipment, and as with the standard flowchart, arrows are used to indicate the sequential flow from one to another. There are several types of control flow diagrams used: configuration decision control flow diagram are used in configuration management; quality control flow diagram are used in quality control; change control flow diagram are used in project management; and process control flow diagrams are used in the software engineering practice. Obviously the last two types of flow chart diagram, change and process, can be used and adapted in the UCD process and are useful tools for understanding behavioural aspects of the software engineering system in the large. In software and systems development control flow diagrams can be used in control flow analysis, data flow analysis, algorithm analysis, and simulation. Control and data flow analysis are most applicable for real time and data driven systems. In reality these flow analyses, transform logic and data requirements text into graphical flows that are easier to analyse, and convey to the software engineer, than the text itself.
Each of these different flow diagramming techniques are useful in-and-of themselves, however, in combination the flowchart, data flow diagram, and control flow diagram of very effective in conveying human facing aspects of the system in the context of the input and output requirements of that system.
7.3.2 State Transition Diagram
A state transition diagram, also known as a state diagram, is different from flowcharting because each node of the diagram represents a specific system state, not a fact within that system, and is used to describe the behaviour of a system. This behaviour is analysed and represented as a series of events that could occur in one or more possible states. State transition diagrams require that the system be composed of a finite number of states which in some cases are true and tangible states and at other times are more abstract. Diagrams are made up of nodes and arcs (circles with connecting arrows). Each node is divided in half with the state being written in bold within the top half, and the entry action written with in the bottom half. This entry action specifies the state that must currently exist for this new state to be entered. The directed arrows represent transitions between states, and these are all labelled with the transition condition. There are many forms of state diagrams which differ slightly and have different semantics. One such possible representation is the state transition table.
State transition tables are normally two-dimensional, most commonly with a series of events denoted as the columns and a series of states denoted as the rows. At the intersection of the state and event, a specific action is denoted along with the new state that will be reached if that action is undergone. A second, but a less common way of denoting the table, is that the next state is denoted within the column and the current state is denoted within the row. The intersection of these two states has the action, and the event placed within it.
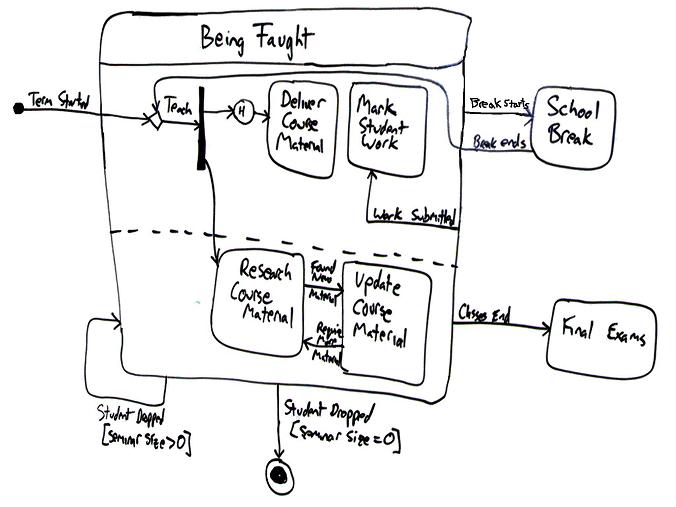
State transition diagrams and tables are used to specify any behaviour a system may exhibit (see Figure: State Transition Diagram). This may be changed within the program logic or within the actual user interface itself. Within the context of the UCD, state transition diagrams and tables can be used to specify the user-facing aspects of the system and the states that the interface should move between as the user’s interactive behaviour involves. It is therefore very easy to understand how the system should be left after specific events have occurred and, therefore, it is easy to test if those events and conditions have been met in a rigorous and specific way. This kind of technique also dovetails into the natural engineering processes that will be familiar to most software engineers and means that it is a powerful technique for conveying interactive behaviours between the UX domain and the software engineering domain.
7.3.3 The Unified Modelling Language (UML)
UML was developed in the mid-1990s to overcome the problems with other diagrammatic representations of object-oriented software [Ambler, 2005]. Since then it has to evolved and has become the most popular modelling language within the software engineering process and has been extended from its initial object-oriented focus to enable an entire system to be modelled. It includes primitives to represent use case diagrams, class and package diagrams, sequence and state machine diagrams, communication, components, and deployment diagrams along with activity diagrams and diagrammatic conventions associated with database creation and relational modelling. In this case, it is highly likely that any software engineer creating modern applications will understand the modelling language, and what is more there are many tools for describing UML models and some tools that generate software from these descriptions. In this case, UML models may be automatically transformed to other representations (e.g. Java) using Query/View/Transformation QVT-like transformation languages. UML is a de facto industry standard and is evolving under the auspices of the Object Management Group with many industry leaders helping create the standard. Finally, UML is extensible, offering profiles and stereotypes as the main mechanisms for customisation.
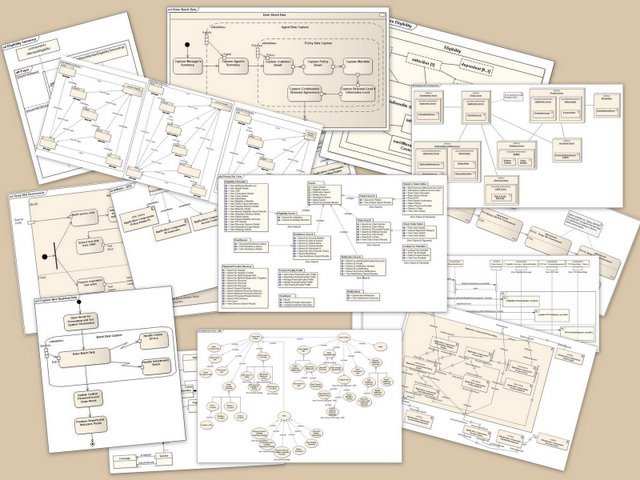
Many books have been written describing UML (and there are many different diagrammatic notations, see Figure: UML Diagram Collage), all running into hundreds of pages, and so attempting a complete description here would be ineffectual. However, a brief overview of the diagrammatic conventions specifically focused to the user-facing aspects may be worth considering; in this way you will be able to read at least these diagrams and have a certain level of understanding as to their meaning. The most common UML modelling element is called the class diagram and looks like a rectangular box divided into three separate sections, at the top the name of the class is given, in the central part each variable is listed, and in the bottom part the methods that work on those variables are described. Next to each definition you may see a plus symbol (+) describe public access, a hash symbol (#) describes protected access, a minus symbol (-) to describe private access, and a tilde (~) to describe a package. A diagram resembles many these rectangular boxes linked together via directed arrows with additional diagrammatic primitives of a stick man representing an actor. A circle with an arrow at the top representing a process/controller class, a circle resting upon a horizontal line representing a domain class, a circle with the letter T placed at the ‘nine o’clock position’ representing and interface class, and finally a horizontal line representing an association. Notes can be added to diagrams in the form of a rectangular box with the top right corner folded over, and a UML frame, which is a bounding box, can be used to logically group aspects of the diagrammatic components together. Finally, the diagramming primitive called a stereotype is signified by its name being written in lowercase between double greater than and less than symbols (< >). The stereotype primitive is used to denote a variation on an existing modelling element, with the same form, but with a modified intent; in object-oriented languages these can often be used to signify inheritance classes.
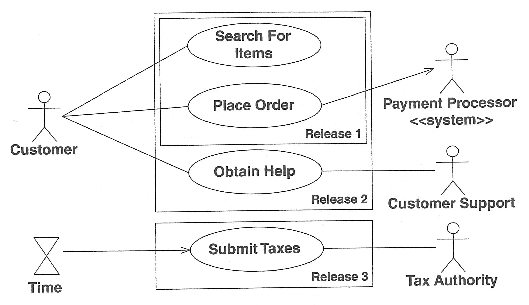
The most important aspect for the UX’er is the UML use case diagram (see Figure: UML Use Case Example). Use case diagrams show relationships among actors and use cases within a system. They provide an overview of usage requirements, communicate the scope of a development project, and model the analysis of usage requirements in the form of a system use case model. Use case names often begin with a strong verb such as ‘open’, ‘close’, ‘save’, ‘deposit’, or ‘withdraw’, etc. Moreover, are normally represented by an actor being linked to a series of oval ‘boxes’ containing the use cases. Use cases that are stacked in a vertical manner imply a sequenced top to bottom. Use cases can be enclosed in rectangles to imply a logical grouping; an actor should be drawn outside of these use case grouping elements. An actor can be associated with one or more use cases, and a single use case can be associated with more than one actor. Associations may exist between an actor and a use case and two use cases, and a generalisation can likewise exist between two actors, or between two use cases. Stereotypes are represented using broken lines to make these connections, with the standard stereotype convention being written next to that line. Also, conditions can be placed upon the associations, and these are denoted by joining that association with a standard note. There are very many more aspects of the mapping of use case diagrams in UML than can be described here. However, this brief synopsis should help you get started and enable you to derive some understanding from informal diagrams you may come across.
As we have seen, more formal modelling can be an important part of the UCD/software creation process, particularly when trying to convey rigorous information regarding user-facing aspects of the system. This is mainly because this kind of information is difficult to quantify especially because users are notoriously flexible and inconsistent in their approaches to applications and systems use.
7.4 Summary
This chapter has highlighted the methods of communication to enable a formal dialogue to be entered into between users, UX’er, and the software engineer. In this way, the needs of the users can be accurately communicated between both parties.
Interestingly, interaction design is at the forefront of Web development because there is no common interface or set of interface tools applicable to the many different needs of the Web user. In this case, it can be seen that the Web provides a blank canvas for the interaction designer and enables many different design and interaction modalities or schemas to be applied. This is in stark contrast to a standard desktop applications that force the user into certain standardised practices as discussed above.
Designing the interaction is usually accomplished in combination with user experience specialists as well as graphic designers and interface engineers. Because this is an interdisciplinary process, there are very few fixed modelling techniques for designing these interactions. Often the most basic methods are used which would apply to all, and in many cases whiteboards and chalkboards are used to discuss possible layouts with post-it notes used to order functionality and design and events within the framework. Storyboarding techniques may also be used to relate better the intended interactions, and the graphic designer may flesh out these models with some initial ideas about how the interface should look or be skinned.
Remember, “In all cases you must think: what information do I need to build a system, how can I get this information, and how can I disseminate this information into the software engineering process, once acquired?”
7.4.1 Optional Further Reading
- [B. Buxton] Sketching user experiences: getting the design right and the right design. Morgan kaufmann, 2010.
- [A. Cockburn.] Writing effective use cases. Addison-Wesley, Boston, 2001.
- [M. Cohn.] User stories applied: for agile software development. Addison-Wesley, Boston, 2004.
- [R. Krum] Cool infographics: Effective communication with data visualization and design. John Wiley & Sons, 2013.
- [B. Shneiderman] Designing the user interface: strategies for effective human- computer interaction. Addison-Wesley, Reading, Mass. 1987 (this is a famous book now in its fourth edition)
7.4.2 International Standards
- [ISO 9241-210:2010.] Ergonomics of human-system interaction – part 210: Human-centred design for interactive systems. TC/SC: TC 159/SC 4 ICS: 35.180; 13.180 / Stage: 60.60 (2010-03-03), International Organisation for Standardisation (ISO), Geneva, Switzerland, 2010.