14. User Evaluation
Life is a full circle, widening until it joins the circle motions of the infinite
– Anais Nin
Evaluation methodologies are the principal means by which the UX specialist answers the questions ‘What needs to be done?’, and after an interface manipulation has occurred, ‘What is the effect of this manipulation?’
There are many ways to categorise different evaluation methodologies within UX. Here I equate naturalistic field evaluation with the qualitative methods of anthropologists, I see quantitative methods, characterised by sociological surveys, as being between fieldwork and laboratory experimentation (we’re already looked at these). Finally, I see laboratory-based evaluation, mainly in non-naturalistic settings, as being the main way of enacting true experimental methods most often used within experimental psychology and the cognitive sciences.
Each of these key categories has a unique way of viewing the world and a particular set of strengths arising from the kind of evaluation and answers needed. There are many debates within each particular discipline as to the kind of methods that give the best outcomes. However, in UX we can take a more pragmatic approach and select the appropriate evaluation method from each category, combining them all together in our final experimental design, so that we can build an end-to-end story.
If you notice, I’m using the term ‘evaluation’ quite frequently. This is because these methods all evolved from scientific evaluation methods within a particular academic discipline. But do not be confused, their applicability to real-world scenarios and their use within practical settings, of the kind we often face in application and interface development, is what has made them popular and particularly suited to the kinds of questions the UX specialist is required to answer.
Evaluation methods are slightly different from the kind of requirements analysis and requirements elicitation scenarios that we have seen. As we state there, requirements analysis and elicitation, along with the models that are created from them, are often engineering – or craft based – as opposed to having their roots within empirical scientific methodologies; certainly this is the case informally. In this case, they are more akin to the qualitative evaluation methods of participant observation, interviewing, or focus group discussion. However, these three methods are not bound with the same kind of system architecture design metaphors and methods as are those of requirements analysis. It is my opinion that this makes requirements analysis far weaker than the evaluation methods we will discuss here. I would only hazard a guess, which this is the case because the final testing of the software system will validate or invalidate the requirements model, whereas, there is no such concept of a final implementation validating an evaluation method in the domain of anthology or sociology. This means that, if the model is wrong, a large amount of time is needed to fix it at the end of the project. In some cases, this means that the interface is left unfixed because time and cost constraints dictate a speedy completion.
Understanding the requirements – and having the tools to create experimental methods to test the interface is correctly created from those requirements – are key to the user experience. As such, this chapter should be one of your primary references when creating testing and evaluation plans involving the user.
14.1 Expert Evaluation via the Audit
Walk-throughs and heuristic evaluations are closely linked and listed here because they are slightly different from the other techniques introduced. They differ because they mainly occur before formal evaluation with participants and are often conducted by the evaluator, or the UX specialist responsible for creating the interface, themselves.
14.1.1 Walk-throughs
There are many flavours of walk-throughs including the cognitive walk-through and the barrier walk-through, along with the code walk-through. However, in all cases, the evaluator formally addresses each step of the system based on the interaction that is required and the system components that are required to enact that interaction. At each stage, the outputs, inputs, and performance will be evaluated, and this presupposes that the walk-through is far more about an evaluation of the system performing correctly than it is about the aesthetic or design nature of the interface itself. In this case, walk-throughs can also be used to understand how easy the system is to learn and whether aspects of usability, such as progressive disclosure, or accessibility are present. However, to create a reasonably accurate walk-through the evaluator needs to have a good understanding or description of the prototype system; a description or understanding of the task the users are to perform; the action that is required to complete the task; and an indicator of who the users will be. This last indicator is particularly difficult in that it presupposes the evaluator understands all aspects of a user’s behaviour and character that, as we have seen, can be particularly difficult to assess.
14.1.2 Heuristic Evaluation
Related to the walk-through is the heuristic evaluation. This approach differs from the walk-through only in that there are specific aspects that need to be assessed as the evaluation proceeds. These aspects are based upon the general principles that have already been covered. However in this case, as opposed to the developer walking through the different scenarios of user interaction, a set of evaluators are asked to independently answer questions regarding the usability of the interface, rating different aspects as they go. Once complete, average ratings can be generated for all aspects of the interface based on the consensus opinion of the evaluators. This is a reasonably effective method and is often used as an initial test before the main evaluation begins.
In both cases an expert user, or key participant (informer), is required to perform these evaluations and the results of the evaluation are very much based on the skills, ability, and knowledge of the evaluator. In reality, this means that the principles that you have learnt should be reapplied back into development, but this time as questions. These questions may take the form of ‘Is the need to Facilitate Progressive Disclosure met?’, ‘How is Progressive Disclosure met?’, or the questions to think about when designing your prototype to Facilitate Progressive Disclosure) – such as ‘Is there a tight logical hierarchy of actions?’ – could be used as metrics for understanding the success of failure.
14.2 Qualitative (Fieldwork) Methods
Anthropologists and sociologists describe field evaluation variously as fieldwork, ethnography, case study, qualitative evaluation, interpretative procedures, and field evaluation. However, among anthropologists fieldwork is synonymous with the collection of data using observational methods. For the sociologist, the term often describes the collection of data using a social survey. While it was often thought that these two competing methods of qualitative and quantitative evaluation are disjoint, many sociologists also utilise participant observation, structured interviews, and documentary evidence as interpretive methods. These methods owe much to social anthropologists following the theoretical tradition of ‘interactionism’; interactionists place emphasis on understanding the actions of participants by their active experience of the world and the ways in which their actions arise and are reflected back on the experience. This is useful for the UX specialist as the interactionists component of the method makes it quite suitable investigating subjective aspects.
To support these methods and strategies, many suggest the simultaneous collection and analysis of data. This implies the keeping of substantive field notes consisting of a continuous record of the situations events and conversations in which the practitioner participates [Van Maanen, 2011]; along with methodological notes consisting of personal reflections on the activities of the observer as opposed to the observed. The field notes should be preliminary analysed within the field and be indexed and categorised using the standard method of ‘coding’ different sections of the notes to preliminary categories that can be further refined once the fieldwork has concluded.
The most used methods on qualitative evaluation are participant observation, interviewing, archival and unobtrusive methods. I suggest that these methods are mainly used for building a body of evidence that is deep but narrow in extent and scope. The evidence can then be used to help generate hypotheses, and understanding, to be confirmed in later tests. In this case, aspects of Mills Method of Agreement can be used to build evidence before the computational artefact, the application, utility, software, or system is created. Indeed, these methods will give you an idea of what to build or what is wrong with whatever already exists.
14.2.1 Unobtrusive Methods
Imagine you have been employed by the local library to review the number and placement of cataloguing terminals that can be used for book searches by the general public. If these terminals are all placed together large queues form, and besides, members of the public must return from the area of the library, they are in, to the area that houses the centralised terminals if they wish to evaluation the catalogue. To determine how many terminals are required, and in what locations, you may wish to conduct an analysis of floor tile wear, by visual inspection and also by consulting the maintenance records of the library. In this case, you will be able to understand the amount of traffic to each of the different library sections and optimise the placement of terminals along these routes and in these areas. If you decided to use this approach then, you would be using a methodology that is unobtrusive to the participants (in this case library users).
‘Unobtrusive methods’ is a phrase first coined in 1965/66 and the book in which it was first proposed has since become a classic [Webb, 1966]. Simply, unobtrusive methods propose that evaluations should look for traces of current activity in a similar way to the way archival material is used as a past by-product of normal human activities. This unobtrusive way of investigation is important because in direct experimentation unintended changes can occur, as part of the investigator intervention, which skew the findings (think ‘Bias’).
These sources of invalidity can be roughly categorise as ‘reactive measurement effect’ or ‘errors from the respondent’ such as:
- The guinea pig effect, whereby people feel like guinea pigs being tested in experiments and so, therefore, change their behaviour patterns;
- Role selection, whereby participants see the experimenter as taking a certain role, having an elevated status above the participant, who therefore follows that experimenters lead;
- Measurement as change agent, in which aspects of the initial measurement activity introduces real changes in what’s being measured; and finally,
- Response sets, whereby respondents will more frequently endorse a statement than disagree with its opposite.
Also, errors from the investigator can also be introduced. These range from the interviewer effect, whereby characteristics of the interviewer contributes to the variance in findings because interviewees respond differently to different kinds of interviewer based on the visible and audio cues which that interviewer gives. And changes in the evaluation instrument, whereby the measuring instrument is frequently an interviewer, whose characteristics we have just shown may alter responses, yet that interviewer changes over the course of the investigation. To overcome these possible errors, all contact with participants is removed, and the practitioner bases their findings on observation – Simple Observation – of both the participants and the environment.
Simple observation is the practice of observing exterior physical signs of people as they are going around their normal business along with the expressivity of their movement and their physical location in conjunction. This kind of observation can be extended to include conversation sampling, and time duration sampling for certain observable tasks. Of course, enhanced observational techniques known as contrived observation may also be undertaken. Here techniques such as hardware instrumentation can be particularly useful for different kinds of computer-based activity as long as ethical considerations are taken into account. In general, unobtrusive methods take a holistic approach of the participant, the task or activity, and the environment. By observing, but not intervening or questioning, the UX specialist can understand the interaction activities and interface issues of individuals enacting a real system in a natural setting without disturbing or affecting that system. We can see how unobtrusive methods can be applied to understanding the user experience from a social perspective in.
14.3 Quantitative & Hybrid Methods
As we have seen, qualitative methods are mainly used for building a body of evidence that is deep but narrow in extent and scope. The evidence can be used to help generate hypotheses, and extend understanding, to be confirmed in later experiments. Simply, hybrid and quantitative methods give the UX specialist the tools and techniques to enact these confirmatory experiments [Tullis and Albert, 2008]. Questionnaires, also know as survey methods, are probably the most flexible and useful tools we have for gathering this kind of confirmatory information. They are widely used in the social sciences, as the main form of a systematic method for empirical investigation and critical analysis, to develop and refine a body of knowledge about human social structure and activity.
However, questionnaires have some facets that need careful consideration if the quantitative results produced by their application are to be valid. For instance, questionnaires already make many assumptions regarding the domain under investigation, obviously, the mere activity of asking a specific question has some very implicit assertions associated with it. Therefore, even questionnaires that look to be appropriate may in-fact, be biassed. Indeed, practitioners have criticised the tradition that has allowed questionnaires to become the methodological sanctuary to which many UX specialists retreat. In this context, the most fertile search for validity comes from a combined series of different measures each with its idiosyncratic weaknesses each pointing to a single hypothesis. In this case, when a hypothesis can survive the confrontation of a series of complementary methods of testing it contains a degree of validity unattainable by one tested within the more constricted framework of the single method. Therefore, practitioners have proposed the hybrid method; also known as mixed methods or triangulation. Here, many complimentary methods are used and indeed this approach is the one I would espouse for most UX work.
Methods that I classify as between field and laboratory are meant to signify quantitative methods used to retest knowledge derived from qualitative investigations and confirm the initial hypothesis selection process. While, quantitative methods are often used as the only method applied to many social science questions, in UX they do not stand up as verifiable when evaluating or testing an interface or human facing system. A more rigorous approach is required in this case in which experimental metrics can be directly applied in a controlled environment.
14.3.1 Card Sorting
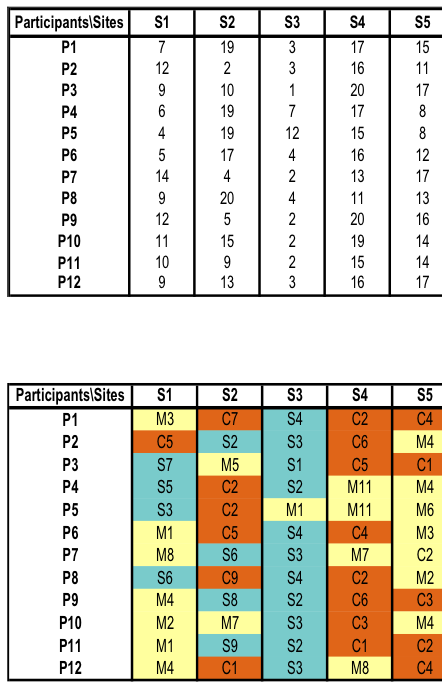
There are several well-understood experimental methodologies used for knowledge elicitation. One such methodology is card sorting techniques used along with triadic elicitation techniques to capture the way people compare and order different interfaces based on different criteria. This framework allows the UXer to investigate both qualitative and quantitative aspects of the user experience while recognising that participants are difficult to recruit. By using card sorting methods, you can produce a quantitative analysis with a definite error rate and statistical significance, and by using triadic elicitation, you can also accommodate the most illusive aspects of the user experience and add depth to the quantitative data.
Card sorting is the simplest form of sorting. During this procedure, the participant is given many cards each displaying the name of a concept (or images / wireframes / screenshots, etc.). The participant has the task of repeatedly sorting the cards into piles such that the cards in each pile have something in common. By voicing what each pile has in common, or the difference between each pile, or description of the characteristics of each pile, the participant is vocalising implicit knowledge they have about the things on the cards.
Suppose we wish to find the attributes of a Web page, by which it is judged as simple or complex. Here, the cards are a screen-print of each Web page that was used for testing. With the continuous sorting, the participant is unintentionally giving information on the attributes and values to describe the characteristics of each Web page, describing the reasons for the perceived complexity.
Triadic elicitation is often used along with card sorting techniques. During this technique, the user is asked about what they think is similar and different about three randomly chosen concepts and in what way two of them similar and different. This technique is used to elicit attributes that are not immediately and easily articulated by the user and helps to determine the characteristics of the card sorted concepts. Further, picking three cards forces us into identifying differences between them – there will always be two that are closer together, although which two cards that are may differ depending on your perspective. The application is very simple. Basically, you select three cards at random, you then identify which two cards are the most similar. Now analyse what makes them similar and what makes them different.
14.3.2 Socio / Unobtrusive Methods
There are many ways to conduct unobtrusive observations within the user experience domain, these might range from remote observations in the real world – of peoples mobile phone usage, say – to collecting data via proxy methods and based on website usage, etc. UX can be unobtrusively measured, directly or indirectly; individually or collectively. And by having the proper metrics, UxD can be leveraged towards the constant improvement of products and services. And this can, I argue, be replicated and generalised across products and services. Let’s have a look at kinds of metrics that can be used.
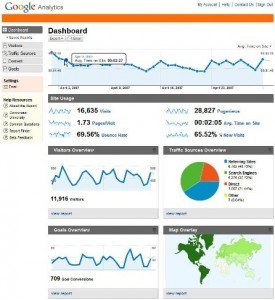
Analytics (PULSE + HEART) [Rodden et al., 2010], Social Sensing or Net Promoter Score Are unobtrusive observational methods that collected and – better still – combined enable us to understand how people feel about a website or desktop application. PULSE – Page views, Uptime, Latency, Seven-day active users (i.e. the number of unique users who used the product at least once in the last week), and Earnings (for instance see Google Analytics PULSE Example – can be derived from standard quantitative data, however HEART – Happiness, Engagement, Adoption, Retention, and Task success – requires a little more social networking and user monitoring. In both cases, by understanding the quantity, types, and return rates of users we can infer favourable experiences once we have some social sensing data. My rational here is that analytics provides us with information that is all inferential – people may return to the site not just because they like it but because they have no choice because they want to complain because they found it difficult last time. But if people are also tweeting, Facebook ‘liking’ then you can expect that if this figure is say 20% then over 60% will like the site but can’t be bothered to ‘Like’ it – this is the same with Net Promoter Score1.
How to capture the user experience in a single session, this is difficult with any degree of accuracy. This could be thought of as the kind of user evaluation method you will become used to. In reality, one session does not make a good evaluation, you should think about the possibility of introducing proxies2 to collect longitudinal usage data.
Mindshare goals – qualitative measures such as awareness, branding effectiveness. In general how much chatter is there in the media, around the coffee machine, water cooler, about your application or site. Lots either means love or hate, silence means mediocre. This is mainly a marketing metric, applied with few changes into the UX domain – indeed, there are some obvious similarities between Mindshare and Social Sensing as discussed in ‘Analytics…’.
Customer support responsiveness and Customer satisfaction evaluation. Quantitative and qualitative loyalty. This is a general purpose quantitative and qualitative interview or questionnaire in which consumer satisfaction can be elicited on a wide scale with deployed resources. You normally find this kind of thing in Social Science, and these techniques haven’t changed much in the move to UX. One interesting development is their combination with social metrics such that peer review is provided by giving star ratings to various resources, or as part of ‘Net Promoter’.
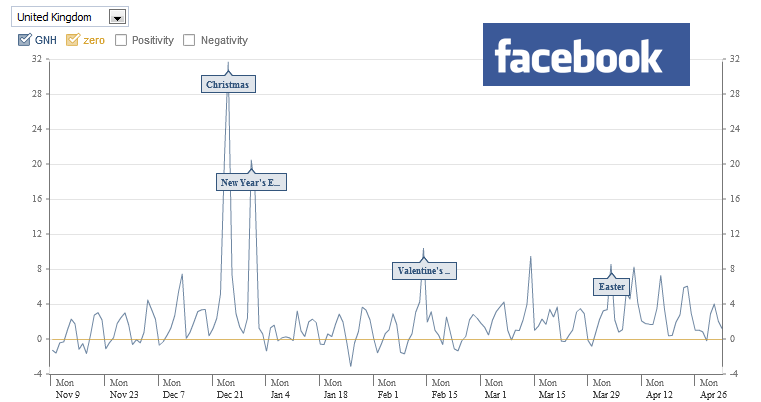
Now these methods should interest you (for example see Facebook ‘Gross National Happiness Index’) – not least because their creation, application, and the inferences made from the resultant data tie into user feedback without participant bias. As we’ve previously seen, UX pays more attention to the individual and subjective realm in which ‘intangibles’ are required to become tangible for testing purposes – so that user feedback can be factored into the new design.
So how do we form these methods into a cohesive framework, well the jury is still out, but Google think it is via Goals, Signals, and Metrics.
Goals: “The first step is identifying the goals of the product or feature, especially regarding user experience. What tasks do users need to accomplish? What is the redesign trying to achieve?” Signals: “Next, think about how success or failure in the goals might manifest itself in user behaviour or attitudes. What actions would indicate the goal had been met? What feelings or perceptions would correlate with success or failure? At this stage, you should consider what your data sources for these signals will be, e.g. for logs-based behavioural signals.” Metrics: Finally, “think about how these signals can be translated into specific metrics, suitable for tracking over time on a dashboard” again playing into longitudinal observation —Google.
14.3.3 A Short Note on Longitudinal Observation
Observation of user behaviour when interacting with applications and the Web – especially for the skill gaining process – is better observed at a longitudinal fashion. This statement is founded on the fact that increased intervals enable the consolidation of declarative knowledge in long-term memory, where consolidation does not happen automatically, and it is not determined at the time it has been learned. To gain insights into the user experience in the context of your development, we should conduct a longitudinal analysis of those users if at all possible.
14.3.4 Think-Aloud
It is sometimes difficult to understand exactly what the user is thinking or, in some cases, doing when they are navigating a complex interface. This is especially the case when the user is familiar with the interface and interaction, and may even be undertaking different, but related, tasks at the same time as the primary task. In this case, to understand explicitly the activities and thoughts of the user, as they are performing the interaction, the think aloud methodology can be used [Lazar et al., 2010].
The think aloud methodology is a classic of the UX evaluation process evolving mainly from design-based approaches (created by Clayton Lewis while at IBM). It produces qualitative data and often occurs as part of an observational process, as opposed to a direct measurement of participant performance, as would be normal in laboratory settings. While it is true that think aloud requires tasks to be completed, the object is not the direct measurement of those tasks. Instead, it is the associated verbalisations of the participants as they progress through the task describing how they are feeling and what they think they need to do.
Think aloud is intended to produce data which is deeper than standard performance measures in that some understanding of the thoughts, feelings, and ideas that are running through the mind of the participant can be captured. The main problem with think aloud is, also its strength in that, it is very easy to set up and run, and therefore, the design aspect of the tasks can be ill conceived. In this way, it is often easy to implicitly influence the participant into providing outcomes that are positive regardless of the true nature of the interface or interaction. Indeed, the very act of verbalising their thoughts and feelings means that participants often change the way they interact with the system. It is for this reason that think aloud should not be used as a methodology on its own but should provide the qualitative aspects lacking in other quantitative or performance-based measures.
14.3.5 Co-Operative Evaluation & Participatory Design
As we have seen3 Co-operative evaluation and participatory design are closely related techniques that enable participants to take some form of ownership within the evaluation and design process. It is often thought that these participants will be in some way key informants, as we have seen in participant observation, and will therefore have an insight into the systems and interfaces that are required by the whole. Both methods are closely linked to the think aloud protocol, but instead of entirely focusing on evaluation the users are encouraged to expand their views with suggestions of improvements based on their knowledge of the system or interfaces that are required. Indeed, the participants are encouraged to criticise the system in an attempt to get to the real requirements. This means that in some cases a system design is created before the participatory or co-operative aspects have begun so that the participants have a starting point.
UCD and cooperative evaluation are related approaches that emphasize the involvement of users in the design and evaluation of interactive systems. While user-centred design focuses on incorporating user feedback throughout the design process, cooperative evaluation specifically addresses the collaborative and iterative evaluation of a system with users. User-centred design involves understanding user needs, preferences, and behaviours through methods such as user research, interviews, and observations. This user understanding is used to inform the design of interfaces, products, or systems. Throughout the design process, user feedback is collected and integrated, ensuring that the final product meets user expectations and requirements.
Cooperative evaluation, on the other hand, is a specific technique within the user-centred design process. It involves actively involving users as partners in the evaluation and improvement of a system. Rather than solely relying on expert evaluations or usability testing, cooperative evaluation emphasizes the collaboration between designers, developers, and users to identify usability issues, gather feedback, and suggest improvements. In a cooperative evaluation, users are invited to provide input and insights on the system’s usability, user experience, and functionality. They may participate in various evaluation activities, such as walk-throughs, user testing, think-aloud protocols, or focus groups. Through this cooperative process, users can contribute their first-hand experiences, identify potential issues or challenges, and provide suggestions for enhancements or refinements.
The relationship between user-centred design and cooperative evaluation lies in their shared commitment to involving users throughout the design and evaluation process. Both approaches recognize the value of user input, perspective, and feedback in creating usable and effective systems. By combining user-centred design with cooperative evaluation, designers can engage users as active collaborators, fostering a user-centric approach that leads to more user-friendly and satisfying experiences.
Cooperative evaluation and participatory design are likewise related approaches that share several similarities in their focus on user involvement and collaboration; including:
- User Participation: Both cooperative evaluation and participatory design emphasize the active involvement of users in the design and evaluation process. Users are seen as valuable contributors who provide insights, perspectives, and expertise that shape the final product or system.
- Collaborative Approach: Both approaches foster collaboration and cooperation between designers, developers, and end-users. They encourage open communication, dialogue, and knowledge sharing among all stakeholders involved in the design process.
- User Empowerment: Cooperative evaluation and participatory design seek to empower users by giving them a voice in decision-making and allowing them to influence the design outcomes. Users are seen as experts in their own experiences and are encouraged to actively participate in shaping the design process.
- Iterative and Agile Process: Both approaches embrace an iterative and agile design process. They involve multiple rounds of feedback, testing, and refinement to ensure that user needs and expectations are addressed. The design is continuously adapted and improved based on the insights and feedback gathered from user participation.
- Contextual Understanding: Both cooperative evaluation and participatory design emphasize the importance of understanding the users’ context, needs, and goals. They aim to design solutions that are relevant and meaningful within the specific user context, promoting user satisfaction and usability.
- User-Centric Design: Both approaches prioritize designing for users’ needs and preferences, focusing on creating user-centric solutions. The insights gained through cooperative evaluation and participatory design help ensure that the final product or system aligns with user expectations and requirements.
While there are similarities, it’s worth noting that cooperative evaluation is primarily focused on evaluating and refining an existing system, while participatory design is concerned with involving users in the entire design process from ideation to implementation. Nonetheless, both approaches share a user-centred philosophy and highlight the importance of user involvement in the design and evaluation of systems.
The UX specialist must understand that co-operative evaluation, and participatory design are not fast solutions. Indeed, they should only be used when a firm understanding of the boundaries of the system is possessed. Also, participatory design often runs as a focus group based activity and, therefore, active management of this scenario is also required. Enabling each to fully interact within the discussion process while the UX specialist remains outside of the discussion just acting as a facilitator for the participants views and thoughts is a key factor in the process design.
14.3.6 Survey Questionnaires – Reprise
How do you find out if the system or interface that you have designed and deployed is useful and has useful features? What kinds of improvements could be made and in what order should these improvements be prioritised? To answer these kinds of questions, it is useful to talk to a large number of people, far more than you could expect to recruit for a laboratory experiment. In this case, you may decide to use a questionnaire-based survey, recruiting as many users as you possibly can.
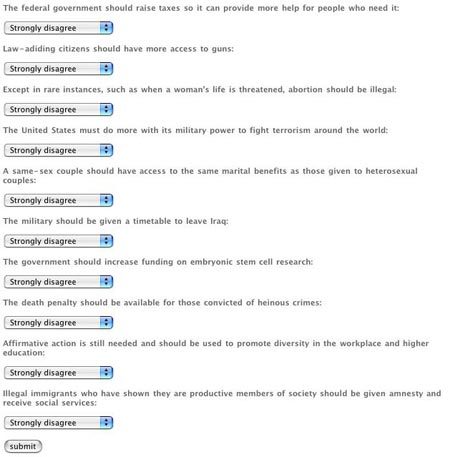
Question-based surveys are usually designed to provide statistical descriptions of people and their activities by asking questions of a specific sample and then generalising the results of that survey to a larger population [Bryman, 2008] (for example Figure: Online Survey Example). This means that the purpose of the survey is to produce statistics and that the main way of collecting information is by asking people questions. In this case, there are three different properties of a good survey, being probability sampling, standardised measurement, and the special-purpose design. Components of a survey sample are based around the question design, the interview method (the questionnaire in this case), and the mode of data collection (verbal or written); all being taken together as total survey design. Critical issues are the choice of how the sample is selected, randomly or non-randomly, creating a probability or non-probability sample; and the sample frame, the size of the sample, the sample design, and the rate of response. One fundamental premise of the survey process is that by describing the sample of people who respond, one can describe the target population. The second fundamental premise of survey evaluation processes is that the answers people give can be used to accurately describe characteristics of the respondent. The sample frame describes the part of the population who have a chance to be selected. Also, if the sample is not random, then the respondents who answer are likely to be different from the target population as a whole. Surveys normally capture two different aspects: objective facts and subjective states. Objective facts include things like the person’s height, whereas subjective facts include, how much of the time the persons felt tired, say.
Designing questions to be good measures, which are reliable and provide valuable and valid answers, is an important step in maintaining the validity of a survey. Always avoid inadequate, incomplete, or optional wording while ensuring consistent, meaningful responses. Remove poorly defined terms and avoiding multiple questions conflated to be a single question. However, it is acceptable to include specialised wording for specialist groups. Remember, participants may be tempted to give incorrect responses if they have a lack of knowledge, or change their answers if they find it socially desirable. This should be pre-empted in the designing of the questions, in which questions should be created as reliably as possible. In addition, there are four different ways in which measurement can be carried out: nominal, people or events are sorted into unordered categories; ordinal, people or events are ordered or placed in all categories along a single dimension; interval, numbers are attached that provide meaningful information regarding the distance between ordered stimuli or classes; and ratio, in which numbers are assigned such that ratios between values are meaningful.
Survey questions should be evaluated before the survey is given using techniques such as focus groups, question drafting sessions, critical reviews, and more formal laboratory interviews. The questions should also be field tested before the main survey becomes available. Remember that survey interviewing can be a difficult job and the type of participant selection is critical in this case. For instance, the commonly used non-probabilistic quota based technique can be particularly troublesome as interviewers are left to survey a certain demographic profile to a certain quota size. This means that many aspects of the validity of a survey are left to the interviewer, who make non-random choices such as choosing houses that are of a higher value, in good areas, without pets or dogs; male interviewers will choose younger female respondents, and female interviewers will choose older male respondents. These biases should be accounted for within the questions and the design of the survey.
Survey methods can be very useful to the UX specialist for confirming qualitative work or evaluating systems that do not immediately lend themselves to the more rigorous laboratory-based methods that will be described in subsequent sections. In the real world, the UX specialist is often unlikely to be able to solicit enough respondents for completely accurate probabilistic methods, and it is more likely that non-probabilistic quota-based methods will be used. However, simple random sampling can be used if the sample frame is tightly defined, and in this case readily available ordinal identification, such as employee number, could lend itself to the selection process. While surveys should not be the only method used, they are useful for understanding general points regarding systems and interactions, over a large set of users who could not normally be evaluated in a formal laboratory setting.
14.3.7 Hybrid Methods
The hybrid method; also known as mixed methods or triangulation are terms used to denote the use of many complimentary methods because the UX specialist recognises the inadequacies of a single method standing alone. Indeed, the hallmark of being a field practitioner is flexibility concerning theoretical and substantive problems on hand. Therefore, the use of ‘triangulation’ (a term borrowed from psychology reports) is used to refer to situations where the hypotheses can survive the confrontation of a series of complementary methods of testing. Triangulation can occur as ‘data triangulation’ via time, space, or person; ‘investigator triangulation’ in which more than one person exams the same situation; ‘theory triangulation’ in which alternative or competing theories are used in any one situation; and ‘methodological triangulation’ which involves within method triangulation using the same method used on different occasions, and between-method triangulation when different methods are used in relation to the same object of study. Indeed, mixed methods contrast quantitative and qualitative work, characterising them by behaviour versus meaning; theory and concepts tested in evaluation versus theory and concepts emergent from data; numbers versus words; and artificial versus natural. In reality, for the UX specialist, the confrontational aspects can be thought of as being purely complimentary.
To a large extent, the UX specialist does not need to concern themselves with the methodological debates that are often prevalent within the human sciences such as anthropology, sociology, social science, and psychology. This is mainly because these methodologies and the instruments which are used within them are not directly created as part of the human factors domain but are used and adapted in combination to enable a verifiable, refutable, and replicable evaluation of the technical resource. In UX, a single methodology would not normally ever be enough to support an evaluation or to understand the interaction of technology and user. However, the view I take of the evaluation domain is far more holistic than may be found in most UX or user experience books. By reliance on only the evaluation aspects of a specific technical interface we miss the possibility of understanding how to make that interface better, not just by metrics as shallow as time to task, but by a combined qualitative and quantitative understanding of the factors surrounding user interaction, both cognition and perception, for a particular software artefact or system architecture.
14.4 Tools of the Trade
As a UXer, there are many tools that you can use both in a laboratory-based setting or in the field. Most tools are portable and so, therefore, can be moved around to different sites and venues such that you are more reactive to the locational needs of your participants; as opposed to expecting them to come to you4.

UX tools range from the very simple, such as the notebook, through audio recording devices, portable cameras and video cameras, screen capture and screen recorders, to the more complex (and costly) static and portable eye trackers, bio–feedback system such as galvanic skin response and heart rate monitors, through to neuro–feedback such as functional magnetic resonance imaging (fMRI), electro-encephalo-graphy (EEG — for example, see Figure: EEG Data Plot Example) , event-related potentials (ERPs), and transcranial magnetic stimulation (TMS) systems. All these tools may be mobile, but now often some of the more expensive tools can only be applied in a laboratory setting, and certainly a laboratory-based setting is useful when you wish to control an evaluation; and the possible confounding factors that may apply to that evaluation.
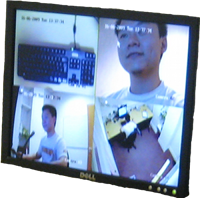
These laboratories, known in the industry as ‘user labs’ or ‘usability labs’, often comprised of three rooms. The first room a user would enter is the reception room where there may be coffee tea and comfy sofas to place the user at ease. There would be a user testing room in which the user and, often, a UXer will sit and conduct the evaluations (this is where the ‘tools’ will be). Finally, there is normally an observation room in which other members of the UX team will observe the evaluations in progress. In some cases, only the user will be present in the user testing room, and only the UX specialists will be present in the observation room5 (see Figure: User Observation).
As we have seen, there are many techniques in the UX specialists arsenal for investigating user behaviour, however, four of the most common listed below:
Performance Measures. Measuring performance is one of the most used techniques for assessing and evaluating interaction. The rationale is that if the task is completed faster than it was before the interactive component was either altered or created when the Interface design must be better as an enhancement has occurred. Common performance measures include: the time required by the user to complete a task; the time spent navigating the interface; the number of incorrect choices or errors created; the number of jobs completed, either correctly or incorrectly; the number of observations of user frustration (see facial expressions below); and finally the frequency of interface components or behaviour that is never used. While performance measures are the most used and most easy to describe to non-specialist audiences, there are some problems that can be introduced at the time the study is created. Indeed, it is often very easy to introduce bias into a set of tasks such that the desired outcome will always be the outcome that performs best. As a UX specialist, you must be especially careful when designing your studies to make sure that this is not the case.
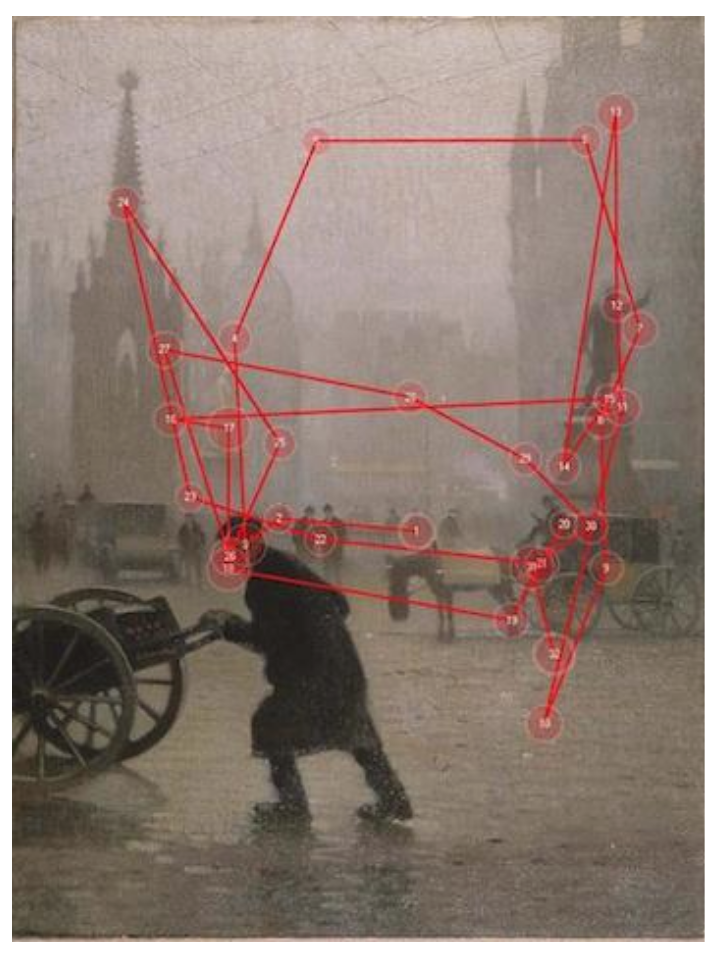
Eye Tracking. Eye tracking technologies are now increasingly used in studies that analyse the user behaviour in a Web search or to reveal possible usability and accessibility problems. Simply, while reading, looking at a scene or searching for a component, the eye does not move smoothly over the visual field, but it makes continuous movements called saccades and between the saccades, our eyes remain relatively still during fixations for about 200-300 ms. A sequence of saccades provides the scanpath (for example see Figure: Eye-Tracking Gaze Plot Example) that the eye follows while looking. Fixations follow the saccades and are the periods that the eye is relatively immobile indicating where it pays more attention, hence, the component that is viewed. Mostly used for usability evaluations we can see their application in determining specific scanpaths about each interface component is highly useful. If each design is associated with a scanpath and fixation points, feedback can be provided for enhancing the design. However, as technology has continued to evolve, applications where an understanding of human perception, attention, search, tracking and decision making are becoming increasingly important. This is because eye movements are driven both by properties of the visual world and processes in a person’s mind. Indeed, tracking eye movements has now become a valuable way of understanding how people allocate their visual attention.
Facial Expression. There are many implicit cues in user behaviour which are difficult to measure by conventional means such as eye tracking or user performance. One way of capturing some of these implicit aspects is by understanding that most users will show these implicit behaviours, such as happiness or frustration, by their facial expressions. Techniques, therefore, exist in which the expression of the user is recorded via a standard computer camera, where each task is timed, and the time of the facial expression is then matched to the task being undertaken at that time. In this way, the specialist can collect a wealth of implicit information concerning the quality of the user experience, if not the participants performance. Again, the UX specialist should be careful to make sure their study is designed correctly and that the analysis of the facial expressions captured in the evaluation is as accurate as possible. Indeed, as we have said before it may be useful to present these expressions, for categorisation, to a disinterested party as a confirmatory step; remember, this is the best way of enhancing the validity of the evaluation when interpretation by the evaluator is required.
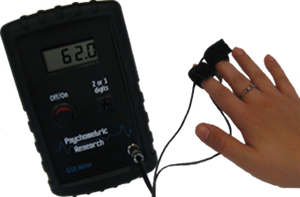
Biofeedback and Affective Measures [Picard, 1997]. As with facial expressions, biofeedback is as implicit evaluation process that involves measuring a participants quantifiable bodily functions such as blood pressure, heart rate, skin temperature, sweat gland activity, and muscle tension, recording the information for later analysis. Within the UX domain the most often used biofeedback measurement is Galvanic Skin Response (see Figure: Galvanic Skin Response) which is a measure of the electrical resistance of the skin; this being a good indicator of the participants stress levels. Also, more simplistic by a feedback mechanism such as heart rate and skin temperature can be used in a non-invasive manner to also ascertain the levels of comfort, excitement, or the stress of a participant. Most biofeedback measurements must be analysed in the context of the individual user in a relative format, so, therefore, increases from the baseline recorded when the user is relaxed and under normal conditions are more important than absolute measurements. One final thing to note for the UX specialist is that undisputed scientific evaluation into the possible application of biofeedback is lacking. This is not such a problem for evaluation and analysis but does indicate the immaturity of this kind of technique.
As a UX specialist you are being asked to perform these kinds of experiments and evaluations for some perceived gain. By conforming as closely as possible to the scientific principles of impartiality the evaluation methodologies and preterite tools, you will be able to maximise these gains, and exhibit a high degree of professionalism in what is often a practical engineering setting. Indeed, as we shall see, pushing a bad interaction design to market will only necessitate a more costly redesign at a later date.
Caveat – Experimental Methods
You may have noticed that I’ve not mentioned any tightly controlled task based trials that measure performance directly - and mostly in laboratory-based settings. These kinds of tests are normally used in research and validation of human performance for critical systems or in ‘hard-core’ usability / HCI trials. I’ve steered away from these because in everyday UX you won’t need to use them, and because we only have a limited time in which to cover UX, and these are not – in my opinion – primary to this domain; but rather human factors, ergonomics, cognitive science, and experimental psychology.
Laboratory-based evaluation using experimental methods has been mainly adopted within the human sciences by experimental or cognitive psychologists requiring similar empirical confirmations as their natural science counterparts. In this case, it is seen that the rigorous and formalised testing of participants can only occur in a controlled laboratory setting. While this is the major strength of laboratory-based evaluation, it is also acknowledged to be a possible problem in that the laboratory is not a naturalistic setting. In turn, the negative aspects are accentuated even beyond that of the survey questionnaire. However, in some cases, the UX specialist has little choice in performing laboratory experimentation because the quantifiable richness and rigour of the data produced is not available from any other source. The power of the arguments created from experimental work is often too strong to ignore, and this is why you will find that when only one opportunity for evaluation exists, the UX specialist will most naturally choose a laboratory-based experimental method; in some ways returning to their computer science / engineering roots.
There are some increasingly understood aspects of laboratory-based work that may be problematic:
- Experimenter Bias: The experimenter my bias the laboratory work via aspects such as the guinea pig effect or role bias;
- Obtrusive Observation: The act of observation changes the observed in some way.;
- Not Longitudinal: And so do not represent users changing states over time and experience; and therefore,
- Not Ecologically Valid: In that the results are only valid in the laboratory and not in the real world.
Further definitive aspects of laboratory-based work are the emphasis placed upon control and validity. Aspects of both can be seen at various points throughout both quantitative and qualitative methods however the focus is far more acute in laboratory-based experimental evaluation. This means that various methods for designing and controlling laboratory-based experimental work have evolved both in psychology and in medicine concerning clinical trials, and we have already covered this to some extent. The key aspect of laboratory-based evaluation is the concept of internal and external validity. External validity refers to the degree to which we can generalise the results of the study to other subjects, conditions, times, and places. While internal validity, is specifically focused on the validity of the experiment as it is carried out and the results that derive from the sample. Remember these terms as we’ll be looking at them in more detail), but for now, if you’d like more information on more experimental methods take an initial look at Graziano and Raulin [Graziano and Raulin, 2010].
14.5 Summary
In summary then, we can see that evaluation methodologies range from the very deep qualitative work undertaken by anthropologists, often resulting in an ethnography, through the broad quantitative work undertaken by social scientists, to the observational empirical work of the experimental or cognitive psychologist. Into this mix comes the interdisciplinary aspects of user experience based in software evaluation and design, and in the form of walk-throughs and think aloud protocols. In all cases, there is a need for a combinatorial approach to evaluation design if an accurate view of the user, and their interaction requirements and experiences, are to be formulated. The value of these aspects of the entire software design cannot be underestimated, without them the user experience cannot be assessed, and a bad user experience will directly affect the approval, and, therefore, sales, of the product under investigation. It’s also not all about participants and numbers, remember, Facebook did UX testing For Facebook Home (With Fewer Than 60 People), 6. However, UX is not solely focused on the interface. Indeed, aspects of the interaction enable us to formulate a scientific perspective and enables us to understand more about the behaviour, cognition, and perception of the user, as opposed to purely focusing on changes to the interface; in this way, UX evaluation methodologies have both practical and scientific outcomes. While I would not suggest that the evaluation methodologies discussed here can be applied in every setting, the UX specialist should attempt to create evaluations that can be undertaken in as near perfect conditions as possible.
So what does all this mean, well ‘methods maketh the discipline’, and I’d say that UX has some nice native methods in use with some others pulled in from other more traditional product marketing domains spliced up with advertising metrics. Importantly, the most interesting for me are HEART+PULSE, which together represent some very innovative thinking that – with minor mods – can be directly applied from UX back to the wider Human Factors CS domain.
14.5.1 Optional Further Reading
- [M. Agar.] The professional stranger: an informal introduction to ethnography. Academic Press, San Diego, 2nd ed edition, 1996.
- [A. Bryman.] Social research methods. Oxford University Press, Oxford, 3rd ed edition, 2008.
- [A. M. Graziano] and M. L. Raulin. Research methods: a process of inquiry. Allyn and Bacon, Boston, 7th ed edition, 2010.
- [J. Lazar,] J. H. Feng, and H. Hochheiser. Research methods in human-computer interaction. Wiley, Chichester, West Sussex, U.K., 2010.
- [J. Van Maanen.] Tales of the field: on writing ethnography. Chicago guides to writing, editing, and publishing. University of Chicago Press, Chicago, 2nd ed edition, 2011.
- [R. W. Picard.] Affective computing. MIT Press, Cambridge, Mass., 1997.
- [T. Tullis] and B. Albert. Measuring the user experience: collecting, analyzing, and presenting usability metrics. The Morgan Kaufmann interactive technologies series. Elsevier/Morgan Kaufmann, Amsterdam, 2008.