Anomaly Detection
Anomaly detection models shine in one very specific class of problem: when you have many “normal” (negative) examples but relatively few “anomaly” (positive) examples — an unbalanced training set. The strategy is to ignore positive examples during training, build a statistical model of what “normal” looks like, and then flag any input that looks too different from that model.
If your training data is roughly balanced between negative and positive classes, you should use a supervised classification model instead. Reserve anomaly detection for situations where normal examples vastly outnumber anomalies.
Motivation
The University of Wisconsin Breast Cancer dataset appears several times in this book. Other chapters use it with supervised learning, where both benign and malignant examples are available in roughly equal numbers. This chapter deliberately discards most of the malignant examples from training to simulate the real-world case where anomalies are rare.
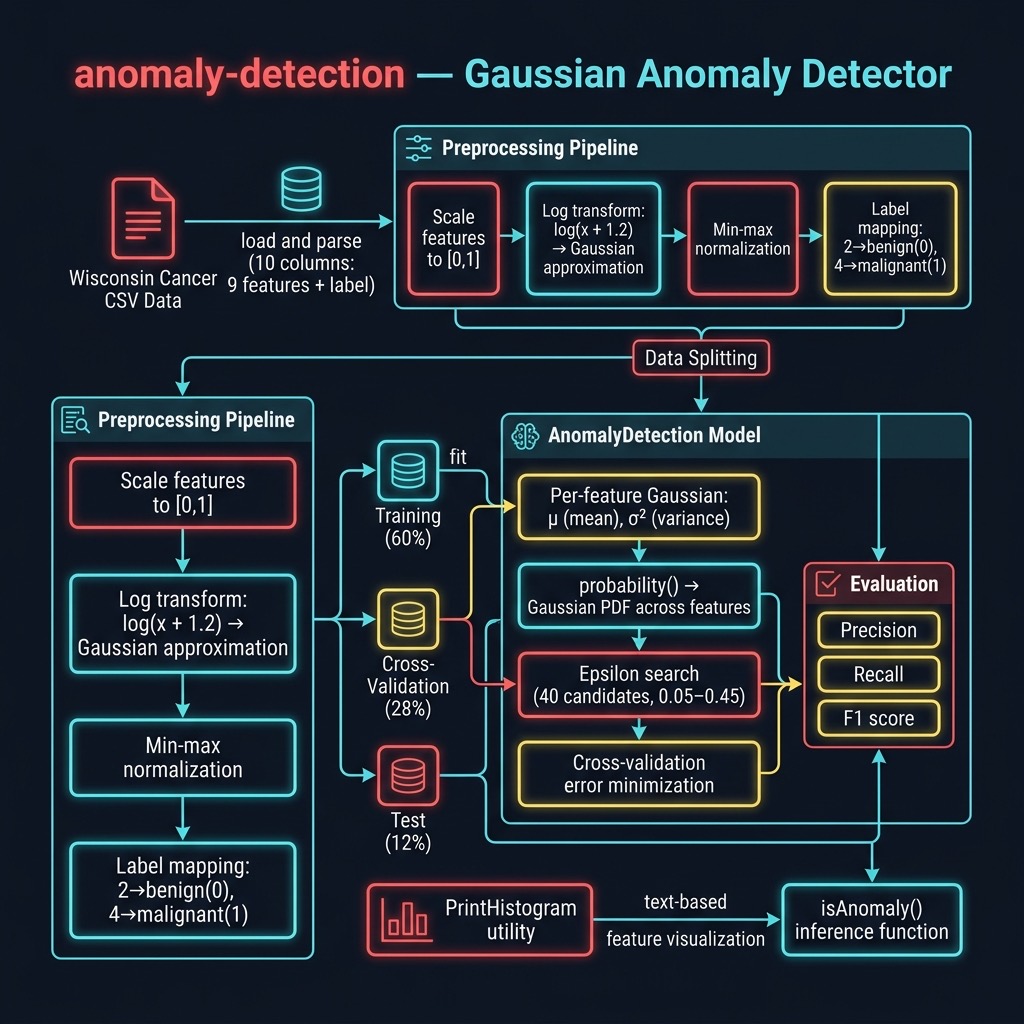
The data preparation strategy is:
- Split all examples randomly into training (~60%), cross-validation (~28%), and test (~12%) sets.
- From the training partition, keep only benign (“normal”) examples — but let about 10% of malignant examples slip through, mirroring the reality that some anomalies will always contaminate a real-world training set.
- Use the cross-validation set to search for a good value of the hyperparameter epsilon.
- Use the test set to compute precision, recall, and F1.
The Gaussian Model
The algorithm models each feature independently with a Gaussian (bell-curve) distribution. For feature j, we learn the mean μ_j and the variance σ²_j from the training data. Given a new input vector x, the probability assigned by the model is the average of the Gaussian densities across all features:
1 p(x) = (1/n) Σ [ 1/(√(2π) · σ²_j) · exp(-(x_j - μ_j)²) ]
If p(x) falls below epsilon, the input is flagged as an anomaly.
The mean is easy to compute from training data. Variance is:
1 σ² = (1/m) Σ (x_i - μ)²
Epsilon is a hyperparameter that we tune against the cross-validation set rather than learning it from training data directly.
Swift Implementation Overview
The Swift port is structured identically to the original Java version but uses idiomatic Swift: value-type arrays ([[Double]]), guard for safety, Bundle.module for bundled resources, and Double.random(in:) instead of Math.random().
Three source files make up the package:
| File | Role |
|---|---|
AnomalyDetection.swift |
Core model class |
PrintHistogram.swift |
ASCII histogram utility |
main.swift |
Data loading, preprocessing, training, inference |
AnomalyDetection Class
The class is initialised with the full example array. The initialiser partitions data into training, cross-validation, and test sets, then computes per-feature means.
 1 class AnomalyDetection {
 2
 3     private static let sqrt2Pi: Double = 2.50662827463
 4
 5     private(set) var bestEpsilon: Double = 0.02
 6     private var mu: [Double]
 7     private var sigmaSquared: [Double]
 8     private let numFeatures: Int
 9
10     private let trainingExamples: [[Double]]
11     private let crossValidationExamples: [[Double]]
12     private let testingExamples: [[Double]]
13
14     init(numFeatures: Int, allExamples: [[Double]]) {
15         self.numFeatures = numFeatures
16         var training: [[Double]] = []
17         var crossValidation: [[Double]] = []
18         var testing: [[Double]] = []
19         let outcomeIndex = numFeatures - 1
20
21         for example in allExamples {
22             let r = Double.random(in: 0..<1)
23             if r < 0.6 {
24                 let isNormal = example[outcomeIndex] < 0.5
25                 let slipThrough = Double.random(in: 0..<1) < 0.1
26                 if isNormal || slipThrough {
27                     training.append(example)
28                 }
29             } else if Double.random(in: 0..<1) < 0.7 {
30                 crossValidation.append(example)
31             } else {
32                 testing.append(example)
33             }
34         }
35
36         self.trainingExamples = training
37         self.crossValidationExamples = crossValidation
38         self.testingExamples = testing
39
40         var muArr = [Double](repeating: 0.0, count: numFeatures)
41         self.sigmaSquared = [Double](
42             repeating: 0.0, count: numFeatures)
43         let n = Double(training.count)
44         for featureIdx in 0..<numFeatures {
45             let sum = training.reduce(0.0) { $0 + $1[featureIdx] }
46             muArr[featureIdx] = sum / n
47         }
48         self.mu = muArr
49     }
50 }
Training: Searching for the Best Epsilon
The train() method loops over 40 candidate epsilon values from 0.05 to 0.44, calling trainHelper(epsilon:) for each. The candidate that produces the fewest cross-validation errors is retained.
 1 func train() {
 2     var bestErrorCount = Double.greatestFiniteMagnitude
 3     for loop in 0..<40 {
 4         let epsilon = 0.05 + 0.01 * Double(loop)
 5         let errorCount = trainHelper(epsilon: epsilon)
 6         if errorCount < bestErrorCount {
 7             bestErrorCount = errorCount
 8             bestEpsilon = epsilon
 9         }
10     }
11     print("\n**** Best epsilon value = \(bestEpsilon)")
12     _ = trainHelper(epsilon: bestEpsilon)
13     test(epsilon: bestEpsilon)
14 }
The Gaussian Probability Function
The private method probability(_:) computes the model score for a single input vector. Note that the last element of the vector is the label column and is skipped.
 1 private func probability(_ x: [Double]) -> Double {
 2     var sum = 0.0
 3     for f in 0..<(numFeatures - 1) {
 4         let denom = AnomalyDetection.sqrt2Pi * sigmaSquared[f]
 5         guard denom > 0 else { continue }
 6         let exponent = -(x[f] - mu[f]) * (x[f] - mu[f])
 7         sum += (1.0 / denom) * exp(exponent)
 8     }
 9     return sum / Double(numFeatures)
10 }
Public Inference
After training, you can classify any new input vector with isAnomaly(_:):
1 func isAnomaly(_ x: [Double]) -> Bool {
2     return probability(x) < bestEpsilon
3 }
Preprocessing the Wisconsin Data
Raw feature values range from 1 to 10. The main.swift file applies two preprocessing steps:
- Scale each of the 9 features by 0.1 to put them in the range [0, 1].
-
Log-transform each feature with
log(x + 1.2)and then min-max normalise back to [0, 1]. This pushes the heavy-tailed distributions closer to a Gaussian shape, which the model assumes.
The label column (originally 2 for benign, 4 for malignant) is mapped to 0.0 and 1.0 respectively.
 1 for i in 0..<9 { xs[i] *= 0.1 }
 2
 3 var minVal =  Double.greatestFiniteMagnitude
 4 var maxVal = -Double.greatestFiniteMagnitude
 5 for i in 0..<9 {
 6     xs[i] = log(xs[i] + 1.2)
 7     if xs[i] < minVal { minVal = xs[i] }
 8     if xs[i] > maxVal { maxVal = xs[i] }
 9 }
10 let range = maxVal - minVal
11 if range > 0 {
12     for i in 0..<9 { xs[i] = (xs[i] - minVal) / range }
13 }
14
15 xs[9] = (xs[9] - 2.0) * 0.5
Feature Histograms
Before training it is worth checking that the data distributions are roughly Gaussian. The PrintHistogram utility prints a simple 5-bin ASCII histogram for each feature. The output reveals that many features have more mass at one extreme — this is exactly the problem that the log transformation above helps to address.
 1 func printHistogram(title: String, data: [[Double]],
 2                     colIndex: Int, min: Double,
 3                     max: Double, numBins: Int) {
 4     var bins = [Int](repeating: 0, count: numBins)
 5     let range = max - min
 6     for row in data {
 7         let x = row[colIndex]
 8         let idx = Int((0.99 * (x - min) / range) * Double(numBins))
 9         let clampedIdx = Swift.max(0, Swift.min(numBins - 1, idx))
10         bins[clampedIdx] += 1
11     }
12     print("\n\(title)")
13     for (i, count) in bins.enumerated() {
14         print("\(i)\t\(count)")
15     }
16 }
Running the Example
1 cd source-code/anomaly-detection
2 swift run
The output includes the cross-validation error counts for each candidate epsilon, the final test-set metrics, and two inference examples:
Results vary between runs because the train/validation/test split is randomised. The key correctness check is malignant result = true, benign result = false.
Interpreting the Metrics
Precision (≈0.73) measures what fraction of examples flagged as anomalies were genuine anomalies. Recall (≈0.94) measures what fraction of all true anomalies the model caught. The F1 score is their harmonic mean and balances both concerns.
In a medical screening context high recall is often more important than high precision: it is worse to miss a cancer (false negative) than to follow up on a benign case unnecessarily (false positive). The model’s high recall (catching ~94% of malignant cases) makes it useful as a first-pass screening tool.
Features that remain far from Gaussian even after transformation (for example “Bare Nuclei” in the Wisconsin data) should be investigated and potentially removed or transformed further. Andrew Ng’s recommendation — taking the log of features or applying other monotonic transformations — is a good starting point.
Summary
This chapter demonstrated how to port a Java Gaussian anomaly detection model to a standalone Swift command-line tool. The key ideas are:
- Fit a per-feature Gaussian distribution to “normal” training examples.
- Tune an epsilon cutoff using a cross-validation set.
- Evaluate precision, recall, and F1 on a held-out test set.
- Pre-process features toward a Gaussian shape to get better model performance.
The complete source is in source-code/anomaly-detection/.