Appendices
Raspberry Pi Quick Set-up
Download Raspbian Image
Download the latest version of the Raspbian Operating System from the raspberrypi.org page; http://www.raspberrypi.org/downloads/.
Writing Raspbian to the SD Card
Once we have the image file we need to get it onto our SD card.
Download and install Win32DiskImager.
Start the Win32 Disk Imager program and select the correct drive letter for your SD card and the Raspbian disk image that you downloaded. Then select ‘Write’ and the disk imager will write the image to the SD card.
Once the process is finished exit the disk imager and eject the card from the computer.
Installing Raspbian
Insert the SD card into the slot on the Raspberry Pi and turn on the power.
Using the Raspberry Pi Software Configuration Tool tool you can first ensure that all of the SD card storage is available to the Operating System. Once this has been completed leave the other settings where they are and select finish.
Once the reboot is complete you login using the default username pi and password raspberry.
Software Updates
Type in the following line which will find the latest lists of available software;
Upgrade the software to latest versions using;
Static IP Address
Configure your home network to make a static IP address available for the RPi. Note your netmask and default gateway.
On the RPi, edit the file /etc/network/interfaces.
Change the line that tells the network interface to use DHCP (iface eth0 inet dhcp) to use the static address that we decided on earlier along with information on the netmask to use and the default gateway. So replace the line…
iface eth0 inet dhcp
… with the following lines (and don’t forget to put YOUR address, netmask and gateway in the file, not necessarily the ones below);
iface eth0 inet static
address 10.1.1.8
netmask 255.255.255.0
gateway 10.1.1.1
To allow the changes to become operative type in;
Remote access via TightVNC
On Windows
To install TightVNC for Windows, go to the downloads page and select the appropriate version for your operating system.
Work through the installation process answering all the questions until you get to the screen asking what setup type to choose.
We only want to install the viewer for the software. Click on ‘Custom’ and then click on the ‘TightVNC Server’ drop-down and select ‘Entire feature will be unavailable’, then select ‘Next’.
The ‘Select Additional Tasks’ selections can be left at their defaults.
Then click on ‘Install’.
Click on ‘Finish’ and you should be done.
On the Raspberry Pi.
From the command line, type;
Now we can run the program by typing in;
You will be prompted to enter a password that we will use on our Windows client software to authenticate that we are the right people connecting. (there is a maximum length of password of 8 characters).
You will be asked if you want to have a ‘view-only’ password that would allow a client to look at, but not interact with the remote desktop.
The software will then assign us a desktop and print out a messages that we will need to note saying something like;
New 'X' desktop is raspberrypi:1
the :1 informs us of the number of the desktop session that we will be looking at.
Now on the Windows desktop, start the TightVNC Viewer program. We will see a dialogue box asking which remote host we want to connect to. In this box we will put the IP address of our Raspberry Pi followed by a colon (:) and the number of the desktop that was allocated in the tightvncserver program (10.1.1.8:1).
We will be prompted for the password that we set to access the remote desktop;
In theory we will then be connected to a remote desktop view of the Raspberry Pi from our Windows desktop.
Starting TightVNC at boot.
We will add the following command into rc.local;
To do this we will edit the /etc/rc.local file with the following command;
Add in our lines so that the file looks like the following;
#!/bin/sh -e
#
# rc.local
#
# This script is executed at the end of each multiuser runlevel.
# Make sure that the script will "exit 0" on success or any other
# value on error.
#
# In order to enable or disable this script just change the execution
# bits.
#
# By default this script does nothing.

# Print the IP address
_IP=$(hostname -I) || true
if [ "$_IP" ]; then
  printf "My IP address is %s\n" "$_IP"
fi

# Start tightvncserver
su - pi -c '/usr/bin/tightvncserver :1'

exit 0
Test that the service starts when the Pi boots by typing in;
When the Raspberry has finished starting up again, we should be able to see in the list of text that shows up while the boot sequence is starting the line New 'X' desktop is raspberrypi:1.
Assuming that this is the case, power off the Raspberry Pi;
Now physically turn off the power to the Pi.
Unplug the keyboard / mouse and the video from the unit so that there is only the power connector and the network cable left plugged in.
Now turn the power back on.
(We will need to wait for 30 seconds or so while it boots up)
Start the TightVNC Viewer program on the Windows desktop and we will be able to see a remote view of the Raspberry Pi’s desktop
Copying and Pasting between Windows and the Raspberry Pi via TightVNC
On the Raspberry Pi, install ‘autocutsel’;
Then edit the ‘xstartup’ file;
… to add in the line autocutsel -fork;
#!/bin/sh

xrdb $HOME/.Xresources
xsetroot -solid grey
autocutsel -fork
#x-terminal-emulator -geometry 80x24+10+10 -ls -title "$VNCDESKTOP Desktop" &
#x-window-manager &
# Fix to make GNOME work
export XKL_XMODMAP_DISABLE=1
/etc/X11/Xsession
Reboot the Raspberry Pi for the changes to take effect.
Remote access via SSH
Setting up the Server (Raspberry Pi)
This is definitely one of the easiest set-up steps since SSH is already installed on Raspbian.
Check that SSH is already installed on Raspbian by typing the following from the command line;
The Pi should respond with the message that the program sshd is running.
If for some reason SSH is not installed on your Pi, install with the command;
Setting up the Client (Windows)
Download PuTTY from here.
Save the file somewhere logical and run the program.
Click on the ‘Selection’ option. On this page we want to change the ‘Action of mouse’ option from the default of ‘Compromise (Middle extends, Right paste)’ to ‘Windows (Middle extends, Right brings up menu)’.
Now select the ‘Session’ Category on the left hand menu. Here we want to enter our static IP address that we set up earlier and enter a name for it as a saved session. Then click on ‘Save’.
Select the raspberry Pi Session and click on the ‘Open’ button.
Click on the ‘Yes’ button to confirm that you trust the host that you’re trying to connect to.
A new terminal window will be shown with a prompt to login as: . Enter our user name (‘pi’) and then our password (if it’s still the default it is ‘raspberry’).
Setting up a WiFi Network Connection
Starting this section makes the assumption that you have a working wireless adapter and advises that the following configuration changes take place with the keyboard / mouse and monitor connected to the Raspberry Pi (I.e. not via a remote desktop).
Start with the Pi powered off and install the USB adapter into a convenient USB connection. Turn the power on and let the device be recognised.
Edit the /etc/network/interfaces file to set up the static IP address on the wireless interface.
This time we will edit the interfaces file using the ‘ssid’ (the network name) of the network that we are going to connect to and the password for the network;
auto lo

iface lo inet loopback
iface eth0 inet dhcp

allow-hotplug wlan0
auto wlan

iface wlan0 inet static
  address 10.1.1.8
  netmask 255.255.255.0
  gateway 10.1.1.1
  wpa-ssid "homenetwork"
  wpa-psk "h0mepassw0rd"
To allow the changes to become operative reboot the Pi;
Once we have rebooted, we can check the status of our network interfaces by typing in;
… or disconnect the wired connection and attempt to connect to the Raspberry Pi via the remote desktop.
Web Server and PHP
At the same time as setting up a web server on the Pi we will install PHP and the library for connecting Python and MySQL.
At the command line run the following command;
Once complete we need to restart our web server with the following command;
We can now test our web server from the windows desktop machine.
Open up a web browser and type in the IP address of the Raspberry Pi into the URL bar at the top and confirm that we can see the test web page.
Adjust permissions for web files
Make the ‘www-data’ group and user the owner of the /var/www directory;
Allow the ‘www-data’ group permission to write to the directory;
Add the ‘pi’ user to the ‘www-data’group;
Reboot the Raspberry Pi to let the changes take effect;
Database
From the command line run the following command;
You will be prompted (twice) to enter a root password for your database. Note it down somewhere safe;
Enter the following from the command line;
phpMyAdmin
To begin installation run the following from the command line;
You will receive a prompt to ask what sort of web server we are using. Select ‘apache2’ (with the space bar) and tab to ‘OK’ to continue.
We will then be prompted to configure the database for use with phpMyAdmin. We want the program to look after it for us, so select ‘Yes’ and continue.
We will then be prompted for the password for the administrative account for the MySQL database. This is the root password for MySQL that we set up earlier. Enter it and tab to ‘OK’ to continue.
We will then be prompted for a password for phpMyAdmin to access MySQL. Use the same password as the MySQL root password to save confusion. Note it down. Then tab to ‘OK’ to continue (and confirm).
Edit the web server (Apache) configuration to access phpMyAdmin by executing the following command from the command line;
Get to the bottom of the file by pressing ctrl-v a few times and there add the line;
Include /etc/phpmyadmin/apache.conf
Save the file and then restart Apache2;
In a browser on the Windows (or on the Raspberry Pi) desktop and enter the IP address followed by /phpmyadmin (in the case of our example 10.1.1.8/phpmyadmin) it should start up phpMyAdmin in the browser.
Enter the username as ‘root’ and the MySQL root password that we set earlier, it will open up the phpMyAdmin interface.
Allow remote database access
By default the Raspberry Pi’s Operating System is set up to deny that access and if this is something that you want to allow this is what you will need to do.
On the Raspberry Pi edit the configuration file ‘my.cnf’ in the directory /etc/mysql/.
Find the section [mysqld] and edit the bind-address line and place a ‘#’ in front of the line to disable it as a configuration option.
#bind-address = 127.0.0.1
Then restart the MySQL service;
Add users to the database
Click on the ‘Privileges’ tab in phpMyAdmin we can see the range of users that are already set up.
We will create an additional two users. One that can only read (select) data from our database and another that can put data into (insert) the database.
From the ‘Privileges’ tab, select ‘Add a new user’;
Enter a user name (‘pi_select’) and password then scroll down a little and tick ‘SELECT’ in the ‘Global privileges’ section.
Then press the ‘Create User’ button and we’ve created a user.
For the second user with the ability to insert data (let’s call the user ‘pi_insert’), go through the same process, but tick the ‘SELECT’ and the ‘INSERT’ options for the data.
Create a database
Go to the ‘Databases’ tab, enter a name for a new database (I’ve called one ‘measurements’) and click on ‘Create’.
Congratulations! We’re set up and ready to go.
Understanding JavaScript Object Notation (JSON)
One of the most useful things you might want to learn when understanding how to present your data with D3 is how to structure your data so that it is easy to use.
There are several different types of data that can be requested by D3 including text, Extensible Markup Language (xml), HyperText Markup Language (html), Comma Separated Values (csv), Tab Separated Values (tsv) and JavaScript Object Notation (json).
Comma separated values and tab separated values are fairly well understood forms of data. They are expressed as rows and columns of information that are separated using a known character. While these forms of data are simple to understand, it is not easy to incorporate a hierarchy structure to the data, and when you try, it isn’t natural and makes managing the data difficult.
JavaScript Object Notation (JSON) presents a different mechanism for storing data. A light weight description could read “JSON is a text-based open standard designed to present human-readable data. It is derived from the JavaScript scripting language, but it is language and platform independent.”
When I first started using JSON, I struggled with the concept of how it was structured, in spite of some fine descriptions on the web (start with http://www.json.org/ in my humble opinion). So the following is how I came to think of and understand JSON.
In the following steps we’ll go through a process that (hopefully) demonstrates that we can transform identifiers that would represent the closing price for a stock of $58.3 on 2013-03-14 into more traditional x,y coordinates.
I think of data as having an identifier and a value.
identifier: value
If a point on a graph is located at the x,y coordinates 150,25 then the identifier ‘x’ has a value 150.
"x": 150
If the x axis was a time-line, the true value for ‘x’ could be “2013-03-14”.
"x": "2013-03-14"
This example might look similar to those seen by users of d3.js, since if we’re using date / time format we can let D3 sort out the messy parts like what coordinates to provide for the screen.
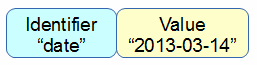
And there’s no reason why we couldn’t give the ‘x’ identifier a more human readable label such as “date”. So our data would look like;
"date": "2013-03-14"
This is only one part of our original x,y = 150,25 data set. The same way that the x value represented a position on the x axis that was really a date, the y value represents a position on the y axis that is really another number. It only gets converted to 25 when we need to plot a position on a graph at 150,25. If the ‘y’ component represents the closing price of a stock we could take the same principles used to transform…
"x": 150
… into …
"date": "2013-03-14"
… to change ….
"y": 25
… into …
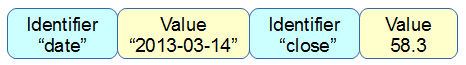
"close": 58.3
This might sound slightly confusing, so try to think of it this way. We want to plot a point on a graph at 150,25, but the data that this position is derived from is really “2013-03-14”, 58.3. D3 can look after all the scaling and determination of the range so that the point gets plotted at 150,25 and our originating data can now be represented as;
"date": "2013-03-14", "close": 58.3
This represents two separate pieces of data. Each of which has an identifier (“date” or “close”) and a value (“2013-03-14” and 58.3)
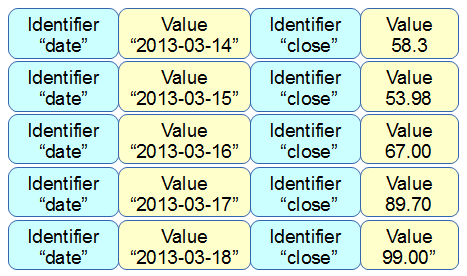
If we wanted to have a series of these data points that represented several days of closing prices, we would store them as an array of identifiers and values similar to this;
{ "date": "2013-03-14", close: 58.13 },
{ "date": "2013-03-15", close: 53.98 },
{ "date": "2013-03-16", close: 67.00 },
{ "date": "2013-03-17", close: 89.70 },
{ "date": "2013-03-18", close: 99.00 }
Each of the individual elements of the array is enclosed in curly brackets and separated by commas.
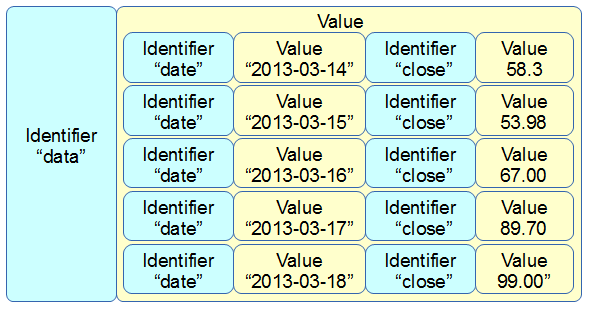
Now that we have an array, we can apply the same rules to it as we did the the item that had a single value. We can give it an identifier all of its own. In this case we will call it “data”. Now we can use our identifier: value analogy to use “data” as the identifier and the array as the value.
{ "data": [
  { "date": "2013-03-14", close: 58.13 },
  { "date": "2013-03-15", close: 53.98 },
  { "date": "2013-03-16", close: 67.00 },
  { "date": "2013-03-17", close: 89.70 },
  { "date": "2013-03-18", close: 99.00 }
] }
The array has been enclosed in square brackets to designate it as an array and the entire identifier: value sequence has been encapsulated with curly braces (much the same way that the subset “date”, “close” values were enclosed with curly braces.
If we try to convey the same principle in a more graphical format, we could show our initial identifier and value for the x component like so;
The we can add our additional component for the y value;
We can then add several of these combinations together in an array;
Then the array becomes a value for another identifier “data”;
More complex JSON files will have multiple levels of identifiers and values arranged in complex hierarchies which can be difficult to interpret. However, laying out the data in a logical way in a text file is an excellent way to start to make sense of the data.