
The Leanpub 60 Day 100% Happiness Guarantee
Within 60 days of purchase you can get a 100% refund on any Leanpub purchase, in two clicks.
See full terms...
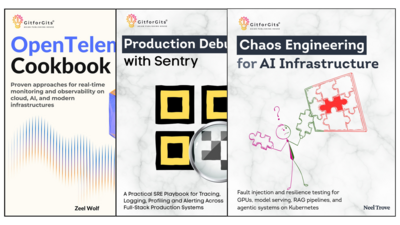
Your tests pass. Your dashboards are green. Then production tells a different story, usually at 2 a.m. This bundle is for the engineer holding the pager.
Instrument everything so nothing breaks invisibly, inject failure on purpose to find weak points early, and resolve real incidents fast when they hit. Trade reactive firefighting for genuine control over what your software actually does once it is live.
Bought separately
$89.97
Minimum price
$74.99
$79.99
About the Bundle
Production is the only place that tells you the truth about your software, and this bundle is for engineers who want to hear it before their users do. It is aimed at the people who carry the pager: the ones who own services once they are live and are tired of flying blind during incidents. Instead of a single tool, it builds a full find-and-fix discipline: instrumenting systems so nothing happens invisibly, deliberately injecting failure to expose weak points early, and resolving real errors fast when they surface.
Owned together, these titles shift a team from reactive firefighting to genuine control. You see what is actually happening, you know where it will break, and you fix it before it becomes an outage.
About the Books

A hands-on, recipe-driven book that puts OpenTelemetry into immediate use. This cookbook is for IT folks like developers, Linux admins, cloud engineers, backend pros, networking experts, and security practitioners. It's for anyone who wants a proven, hands-on way to keep an eye on, trace, and understand modern systems.
This book gives you step-by-step easy solutions to everyday observability challenges, so you can integrate, configure, and operate OpenTelemetry in dynamic environments. Each chapter focuses on solving problems that are directly relevant to production teams. These problems include installing and bootstrapping the Collector on Linux, wiring telemetry pipelines for traces, metrics, logs, and baggage, and integrating with the platforms that organizations trust for analysis and alerting.
Key FeaturesThere's no need to get lost in theoretical jargon because OpenTelemetry Cookbook gets right to the meat and potatoes of implementation. Every recipe gives you a clear problem statement, a step-by-step solution, and practical validation. If you're just starting out with observability or want to level up your skills, this book's got you covered with clear steps to understand distributed, cloud-native, and hybrid systems.
This book builds a solid foundation for strong, easy-to-spot infrastructure and application settings, one step at a time. This book isn't about offering quick fixes or magic solutions. It gives you a full set of tools and techniques that help professionals improve visibility, performance, and reliability in their own technical landscapes.
Table of Content
These days, every company runs on software of which they can't see the full picture. There are orders that fail quietly at two in the morning, a checkout that takes forever to service one customer, and a nightly job that stops running for a week before anyone even notices. So, we've got these standard monitoring reports that say the servers are all good, even though the business is losing money behind the scenes.
With Sentry, you can debug in production and close that gap. This book takes a live system from silence to something that explains itself by working through a single storefront application built with Python and JavaScript. You install error monitoring, join three runtimes into one distributed trace, record the customer's own session, bring structured logs alongside those traces, and profile the exact function spending the time. Then the book moves on to how to run it well. You set alerts that people act on, not mute. And you can build a dashboard that the team will actually open.You can catch jobs that fail by never starting, and hand difficult issues to Sentry's Seer agent while keeping your own judgement firmly in charge.
Key Learnings
Table of Content
Target Readers
Whether you're an engineer, SRE or tech lead, you'll find everything you need to scale your company. All the tasks are routine, you can reproduce them and verify the results. Basics of application monitoring and knowing the lifecycle of application development is all you need to get through this book.

How long do you think it would take you to notice if your AI system started giving worse answers?
Honestly, for most teams, it's weeks, and the news comes from a customer. Chaos engineering answers that question for infrastructure in about thirty seconds, because if a server goes down, it either reroutes or it doesn't. And language models completely shatter all those assumptions. Their output varies for real, their decay builds up instead of happening straight away, and those failures are confident, plausible, and wrong while latency, error rate, and pod health stay exactly where they should be.
This book sets out the new framework for AI infrastructure. You'll find that, working through one support-assistant application across twelve chapters, everything moves from defining steady state for probabilistic systems to injecting faults at every layer, including accelerators, inference servers, model artefacts, retrieval pipelines, model APIs, autonomous agents, distributed training and the monitoring stack itself.
Just to be clear, the toolchain is intentionally kept small. The LitmusChaos orchestrates, the Chaos Mesh reaches the kernel and filesystem, and the mitmproxy handles the content-level faults that neither can touch, extended with custom injectors where nothing suitable exists. So, every experiment comes to one of these four conclusions, and then the last chapter sums them all up as a programme scorecard.
Key Learnings
Table of Content
Within 60 days of purchase you can get a 100% refund on any Leanpub purchase, in two clicks.
See full terms...
We pay 80% royalties on purchases of $7.99 or more, and 80% royalties minus a 50 cent flat fee on purchases between $0.99 and $7.98. You earn $8 on a $10 sale, and $16 on a $20 sale. So, if we sell 5000 non-refunded copies of your book for $20, you'll earn $80,000.
(Yes, some authors have already earned much more than that on Leanpub.)
Learn more about writing on Leanpub
If you buy a Leanpub book, you get free updates for as long as the author updates the book! Many authors use Leanpub to publish their books in-progress, while they are writing them. All readers get free updates, regardless of when they bought the book or how much they paid (including free).
Most Leanpub books are available in PDF (for computers) and EPUB (for phones, tablets and Kindle). The formats that a book includes are shown at the top right corner of this page.
Finally, Leanpub books don't have any DRM copy-protection nonsense, so you can easily read them on any supported device.
Learn more about Leanpub's ebook formats and where to read them
You can use Leanpub to easily write, publish and sell in-progress and completed ebooks and online courses!
Leanpub is a powerful platform for serious authors, combining a simple, elegant writing and publishing workflow with a store focused on selling in-progress ebooks.
Leanpub is a magical typewriter for authors: just write in plain text, and to publish your ebook, just click a button. (Or, if you are producing your ebook your own way, you can even upload your own PDF and/or EPUB files and then publish with one click!) It really is that easy.