Part III - CPIM in the Technotope
Chapter 8 - Identify and Validate in the Technotope
Chapter 9 - Research and Leverage in the Technotope
Chapter 10 - Define and Plan in the Technotope
Chapter 11 - Invest and Execute in the Technotope
Chapter 12 - Perform and Measure in the Technotope
To Part I - II - III - IV - V-Annexes - VI-References
Chapter 8 - Identify and validate in the Technotope
8.1 - Introduction
8.2 - The Decision-Making Context
8.3 - Problem Formulation
8.4 - Establish objectives
8.5 - Scope and level of detail
8.6 - For larger initiatives only
8.7 - Identification and Validation in Open Portfolios
8.8 - Identification and Validation in Programs
8.9 - Identification and Validation in Projects
8.10 - Identification and Validation in Iterations
8.11 - Identification and Validation in the 2030 Agenda
8.12 - Identification and Validation for Library Services
8.13 - Identification and Validation at a Petrol Station
8.14 - Identification and Validation at the Harbour
To Part I (Chapter 1 - 2 - 3 - 4) _ II (5 - 6 - 7) _ III (8 - 9 - 10 - 11 - 12 - (no 13)) _ IV (14 - 15) _ V (Annexes) _ VI (References)
8.1 - Introduction
Performance measures are often about people who receive service. Indicators are proxies for the well-being of whole populations, and necessarily matters of approximation and compromise. Performance measures are about a known group of people who get service and conditions for this group can be precisely measured.
As part of the first step, three activities must always be executed, these are:
- object system problem formulation,
- establishing project objectives/ research questions, and
- determine the scope and level of detail.
Before introducing these steps, we present the concept of a decision frame as a means to unambiguously express both problems with, objectives for and decision options on operational processes (that realize services).
The chapter ends with a list of issues that must be addressed in addition for larger projects.
8.2 - The Decision Making Context
A Results Framework (USAID,2021a) is a portrayal of the development hypotheses through which a Mission expects to achieve the Goal of a Country (or local government unit) Development Cooperation Strategy (CDCS)(USAID,2021b), as part of a Macro journey at the national (or Local) Level of scope.
Visually, a Results Framework brings together several, often quite distinct, streams of results, which function synergistically to produce broad development changes. Thus, an economic growth result in a Results Framework might join with a health (#sdg3 - Ensure healthy lives and promote well-being for all at all ages) and an education (#sdg4 - Ensure inclusive and equitable quality education and promote life-long learning opportunities for all) results to realize CDCS Goal stated in citizen welfare terms.
One example of a macro level results framework is the 2030 Agenda Indicators.
Tversky & Kahneman (1981) use the term decision frame to refer to the decision-maker’s conception of the acts, outcomes and contingencies associated with a particular choice. The frame that a decision-maker adopts is controlled partly by the formulation of the problem and partly by the norms, habits and personal characteristics of the decision-maker.
Decision frames are particularly malleable in contexts where multiple and conflicting objectives are at stake, perceived and technical risks are not well aligned, and difficult tradeoffs must be made in order to implement a particular strategy ((Payne et al, 1992) cited by (Wilson and Bruskotter, 2009)).
Slovic (1995) moreover indicates that people’s preferences are often constructed in the process of elicitation.
Decision Frame (ISO FDIS 15704)
A decision frame describes a set of items that constrain the degrees of freedom for the decision-making on the work system operations (see Figure 1.3) as controlled by a decision center (part of the management activity in Figure 1.4). This frame will not be modified by the decision. Its constituents typically are the result of a decision that has already been made (for instance in the governance activity). To avoid conflicts, a decision center should be under the influence of only one decision frame.
The main items influencing the decision-making are:
- the decision objective or set of objectives the process has to meet;
- the decision variables enabling the decision-maker to know what may be acted on and under what constraints;
- the decision criteria guiding the choice of the decision-making.
Decision objective
Objectives indicate which types of performances are targeted. These performances can be the production costs, the delivery lead-time, the level of quality, for example.
Objectives are needed everywhere and every time a decision is made. Global objectives refer to the entire system or supply chain and, according to the principle of coordination, are consistently detailed to give local objectives to all decision centers.
Decision variable
Decision variables are the items upon which a decision center can make decisions that allow it to reach its objectives.
Decision constraint
Constraints are the limitations on possible values of variables. Decision constraints limit the freedom of a decision center to select any arbitrary value for its decision variables.
Performance measure
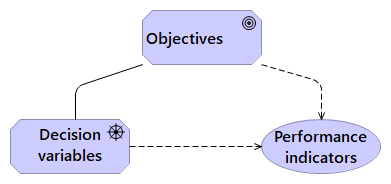
A performance measure is an aggregated piece of information allowing the comparison of the performance of the system to the system’s objectives. A performance measure is defined by its name, a value domain or dimension and a procedure that describes how its value can be calculated.
Consistency
Performance measures should be consistent with objectives because it is necessary to compare performances targeted (objectives) and performances reached (measures). Performance measures should also be consistent with decision variables because those variables will have an effect on the performance monitored (controllability). The main issue is to ensure internal consistency inside a decision center in terms of the triplet presented (see Figure 8.1). This consistency is ensured if the performance measures allow verification of the achievement of the objective and are influenced by actions on decision variables.
Decision Frame and Network Structure
The object system for which decision making is required can have a network structure. Haegele and Klink (1998) state that four basic network structures (mostly used in a IT networking context) can distinguish networks in supply chain relationships. These are tree, bus, star and ring networks. In both tree and star networks there is a central player (for instance the company dominating the supply chain), which initiates the supply chain initiatives and owns the supply chain information system. This governance activity of this central player provides the top-level decision frame that must be refined by the partners in the network.
The partners who are involved in a network usually have the objective to increase their competitiveness. This implies they have to become more effective/efficient in comparison with other networks (chains) that are supplying products/services that compete in any way (similar products, substitute products etc.).
Performance measures, to be appropriate, should cover such areas as those:
- of critical concern to object system common goals and strategies;
- of inter-influence and of common concern among the network partners;
- and concerned by both internal partners and external customers.
A performance measurement method should be based on the process model of the object system, so measures can be derived from process performance. Any process consumes particular enterprise resources, performs the planned missions and functions, and then adds value to products that are delivered to end customers. The consumed resources, and planned functional operations or expected outcomes are the essential performance of processes. Time, labour, capital, power, facilities, and information are typically the resources that processes consume. Traditionally, they can be measured according to their planned functional operations. For example, purchasing process is mainly responsible for material replenishment, supply base management, etc. Thus it can be measured from such performance as material replenishment reliability and quality, and supplier-buyer relationship. Reliability in delivery and transportation, and flexibility in material supply, production, and order delivery have received more and more attention in performance measurement of supply chains. For each process and its sub-processes that need to be measured, the corresponding measures are identified and grouped into the processes and measures hierarchy as shown in Figure 8.2.
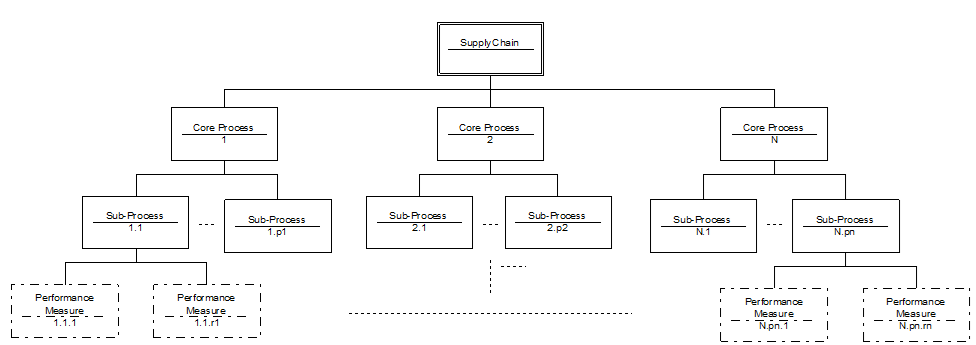
An Object System can be divided into a number of Core Processes. A core process refers to a series of planned activities for original suppliers and manufacturers till retailers that add value for the end customer. These core business processes, which are of essential importance to business objectives and strategies, are suggested to identify and confine the decision frame. The core processes identified can be further decomposed into sub-processes and activities to address their detailed performances. For example, the inbound logistics can be decomposed into such sub-processes as purchasing, transport, supply base management, etc. All these core processes and sub-processes compose the framework for a supply chain Performance Measurement System.
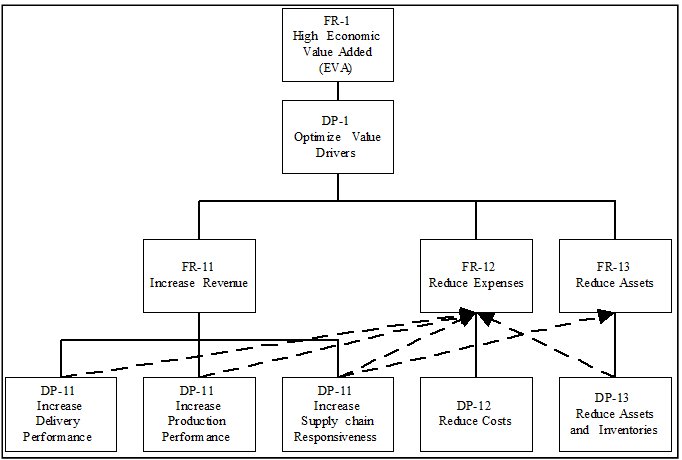
The Supply Chain Design Decomposition (SCDD), is a toolbox for the measurement and improvement of logistics performance in supply chains, which is the result of the application of axiomatic design to SCM (Schnetzler et al, 2004). This axiomatic design was developed at the Massachusetts Institute of Technology (MIT Boston) as a scientific approach for the generation and selection of good design solution for products, processes, and systems (Suh, 2001). Axiomatic design focuses on the identification of functional requirements and the selection of means for achieving them. Objectives are expressed as functional requirements (FRs) for a solution and the possible means as design parameters (DPs) (Engelhardt and Nordlund, 2000). By decomposing the design into several levels of objectives-means-combinations, a causal model of the design is created showing the connections of an objective and the corresponding solution. Axiomatic design has been successful applied to the design of many products, systems, and software as well as to development of manufacturing systems. Manufacturing System Design Decomposition (Cochran et al., 2001) offers a tool to separate objectives from the means to achieve them, to relate low-level activities and decisions to high-level goals and requirements, to understand the interrelationships among the different elements of a system design, and to effectively communicate this information across the organization.
The objective/means hierarchy is illustrated in Figure 8.3. This model is used in relation with the designed “The Process – performance Indicators – Value” network. The highest level of SCDD concerns strategic supply chain management and is set up according to the methodology of economic value added (EVA) as an appropriate representative of the success of the enterprise. EVA can be understood as net operating profit after taxes minus a capital charge, which depends on the total invested capital and the capital costs (Ehrbar, 1998).
In an advanced governance system (van Eijnatten and Goossenaerts, 2004) also the decision-object hierarchies for other objectives such as safety, health, security, environment friendliness, and disaster reduction will need to be defined. Safety and health objectives are expressed with respect to human capital. Security and disaster reduction objectives are expressed with respect to several kinds of capital, with action means in the realm of the social capital. Environment friendliness objectives are expressed with respect to natural capital stocks and flow (see also Rudd, 2004).
In the case of a network structure, a decision frame and all reflective activities (governance, management and analysis and design) may exist for the operations of each sub-system.
Classes of Systems with Analytically Computable Performance
In many change situations it is important to assess the value impact of the proposed change (a setting of a decision variable) on the performance of a system.
For certain classes of systems, for instance M/M/s queues with exponential inter-arrival time distribution and/or service time distribution, certain measures of performance can be analytically computed. These are steady-state average delay, steady state average waiting time, steady-state time-average number in queue, and steady-state time-average number in system (Law & Kelton, 2000, page 97).
The triplet of objectives, decision variables and performance measures for the class of queuing systems looks as follows:
- Objectives: not specified
- Decision Variables:
- Service mechanism: the number of servers; does each server have its own queue, or is there one queue feeding all servers; the probability distribution of customers’ service times.
- Queue discipline: the rule that the server uses to choose the next customer from the queue (if any) when the server completes the service of the current customer.
- Performance Measures:
- (steady-state) average delay
- (steady state) average waiting time
- (steady-state) time-average number in queue
- (steady-state) time-average number in system
- mean service time and service rate
The selection of values for decision variables only becomes meaningful when objectives are stated for a system. If a given object system can be modelled (approximated) by a member of a class of systems for which performance measures can be computed analytically, then design alternatives exist within the same class of systems, where different values have been set for the decision variables in the class of systems. For instance, the number of servers is increased to reduce average delay, or the queue discipline is modified.
When approximating or modeling real life object system operations by classes of systems with analytically computable performance measures, we meet limitations of several kinds:
- the degrees of freedom in the design is limited in comparison to the options that the decision maker or designer has;
- the number of performance measures that can be computed is limited, and may not include performance measures that are consistent with the values and objectives stated for the system;
- for a given object system multiple objectives may be stated (multi-criteria decision making), and there exist decision variables with joint effects for multiple sources of value loss (erosion) (e.g., the study by Lee and Özer (2005) on the effects of misplacement, shrinkage and transaction errors on inventory policies).
In such cases simulation offers an alternative decision supporting technique. It allows the designer to evaluate systems w.r.t. a broad range of decision frames, in which fewer limitations exist for the values, the objectives, the decision variables and the performance measures.
Implications for Simulation
In the study of systems with analytically computable performance, it is common to present the decision frame once and for all, and to further work (= do mathematics) within that decision frame, without revisiting the assumptions that limit their applicability.
When studying the behaviour of operational systems by means of simulation, it is common to adopt the decision frames of well known classes of systems, such as for instance queuing systems or manufacturing systems, and to restrict evaluations to performances that are also analytically computable, or to restrict decision options to those studied analytically.
To really appreciate the value of modeling of operational processes it is important to first define the decision frame that matters for the system studied, and to formulate the problem that initiates the redesign effort, in terms of the decision frame.
Points of attention in the case materials
Open portfolios may emphasize objectives, decision variables and performance measures that are mandatory or recommended for programs, projects and iterations that become part of the portfolio.
- objectives: minimizing environmental impact, or minimizing emissions; maximize the use of shared models;
- decision variables: which portfolio models, or which of their content, to use;
- performance indicator: emission measures.
Programs, projects and iterations may then copy those objectives, decision variables and performance measures into their decision frames and elaborate their business case using them.
8.3 - Problem Formulation
Every decision making engagement begins with a statement of the problem for some operational process or facility that delivers an eco-system, industry or government service.
A problem statement that is provided by the management entity or problem owner (client) is usually informed by immediate ambitions and context of the work-system but may be less aware of all the means that are available for solving the problem, and of constraints.
Very often though, the problem is stated as the absence of something, and the problem owner assumes that the presence of that something is the solution: in other words, the problem owner proposes a solution, or has jumped to a conclusion regarding the solution of his problem, without having done a proper analysis.
By focussing on objectives, performance measures and decision variables one can kick off the path to understanding the problem without such jumping to conclusions.
If a problem statement is prepared, it is important that the client understands and agrees with the formulation.
A problem for an operational process or facility is well understood when it is formulated w.r.t. a decision frame expressing objectives, performance measures and decision variables for the operational process or facility.
Modeling may help in the formulation of the problem.
It is moreover suggested that a set of assumptions is prepared and agreed upon with the client or the interested parties.
Ideally the “scientific” planner would like to have one model that represents and explains the entire system in its environment. Such a model does not exist, but models and data of parts or aspects of the system (the firm, supply, distribution and sales, consumers, competition and environment) are available.
If such models and data exist and are relevant to the scope of a decision problem, then it is important that they can be deployed early in the decision study.
The various layers of the ArchiMate framework support the use of models in the problem formulation.
The models may also be refined or improved. The decision study may require additional data.
Let us review the problem formulation at the levels of open portfolios, programs, projects and iterations by expressing the decision frame for some typical situations.
Problem formulation in Open Portfolios (Macro and meso journeys)
For instance the problem of climate change caused by mankind.
At country level, not meeting a target defined with respect to 2030 Agenda Indicators signals a problem.
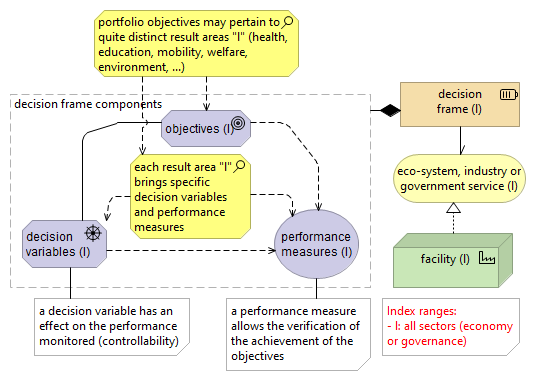
In an open portfolio the range of problems that should be addressed could be very wide, and problems of various facilities could be mutually enforcing.
In such a situation, different decision frames may coexist, one for each facility “l” providing an eco-system, industry or government service for a sociotope. This is depicted in Figure 8.4.
Problem formulation in Programs (Meso and micro journeys)
For instance the contribution of fossil fuels to climate change caused by mankind.
The contribution to carbon emissions by the use of private jets.
In the context of the “Open” 2030 Agenda which defines development goals for different areas of human activity, each of those areas could be the object system of a program’s problem formulation.
Problem formulation in Projects (Micro and pico journeys)
The result framework could be formulated using a balanced scorecard or a similar framework.
Here we give some concrete examples that many may be familiar with. One of the purposes of this e-book is to encourage a similar way of working in meso and macro journeys.
1. Increase plant throughput by 20%
The plant management has been given the directive to increase throughput by 20%, for instance on the basis of a benchmark with competing plants.
The decision frame for the plant operations looks thus:
- Objective: increase plant throughput by 20 %
- Performance indicator: plant throughput
- Decision Variables: not specified
Note that no constraints (operational costs, project budget, on the solution …) are given. It is important that related assumptions are checked with the problem owner. The problem statement is too broad to immediately justify a decision making engagement.
2. Reduce Work in Progress (WIP) by 10%.
The decision frame for the plant operations looks thus:
- Objective: reduce WIP by 10 %
- Performance indicator: WIP during the operations
- Decision Variables: not specified
The problem statement is too broad to immediately justify a decision making engagement.
3. How many AGVs are required?
- Objective: not specified, but it can be assumed that a certain volume of jobs must be performed within a certain period of time
- Performance indicator: e.g., average waiting time, time-average in queue,..
- Decision Variables: the number of AGV’s
In the case that performances cannot be computed analytically (approximately), modeling is recommended.
4. What Schedule achieves best throughput?
- Objective: highest/best throughput
- Performance indicator: throughput
- Decision Variables: a number of available schedules (or scheduling algorithms)
In the case that performances cannot be computed analytically (approximately), modeling is recommended.
It is typical to have multiple dependencies among decision variables and performances. Smaller buffer sizes may not help higher throughput rates, though it may imply lower costs and WIP.
Problem formulation in iterations
As problem messes may be complex it is often irrealistic to achieve a solution in one step. By considering the various properties of the facility and dependencies among the decision variables a stepwise approach which may pass over several plateaus between the current situation and the intended future. Each iteration solves some sub-problems of the overall problem mess. As one progresses from one iteration to the next, additional insight into the facility and the operational processes may open up additional solution paths.
8.4 - Establish Objectives/ Research Questions
This step should be accomplished regardless of location of the analyst and client. The portfolio, program or project objectives indicate the performance questions that are to be answered by the decision making engagement.
Objectives in Open Portfolios (Macro and meso journeys)
The sustainable development goals indicate possible objectives for a wide range of macro- and meso-level development portfolios.
Objectives in Programs (Meso and micro journeys)
The sustainable development goals and benchmarking indicate possible objectives for a wide range of meso- and micro-level programs.
Objectives in Projects (Micro and pico journeys)
Here we give some concrete examples that many may be familiar with. One of the purposes of this e-book is to encourage a similar way of working in meso and macro journeys, with a considerable sharing of objectives and research questions.
Typical objectives can be to verify the throughput time of a new manufacturing line, identify the bottleneck operations in a system, find the proper buffer capacities to attain certain levels of production, determine the best batch sizes and sequence for a multi-product manufacturing line, etc.
One should remember that the objective of a decision making engagement cannot be just to simulate the system(Ulgen et al., 1994), or to develop a system.
Besides answering performance questions about alternative designs of operational processes, there may be project objectives related to time scale, run speed or visual presentation (Mehta, 2000).
The result of project may also be to provide a training tool or an on-going scheduling tool. These study-objectives may affect the way the model should be created. For example, if there are no training purposes for the study deliverables, then simple animation may be sufficient. On the contrary, in case of training purposes animation may appear to be an important tool, 3-D detailed animation may be required.
After the objectives of the study have been finalized, they should be written and stated as part of the portfolio, program, project or iteration documentation.
It is important for any team to remind itself of the original objectives when proceeding with the remaining steps and phases of a portfolio, program, project or iteration.
8.5 - Scope and Level of Detail
The scope and level of detail determine what should be included in the model and how much detail should be modelled.
The model should have a minimum amount of detail required to achieve the objectives at the level of the initiative. At least enough to get confident answers for the specific questions from the study. In many cases, the availability of data and time, experience of the modeller, animation requirements, and expectations of the interested parties are more dominant factors in determining the level of detail than the specific issues to be addressed by the study.
In the portfolio-program-project-iteration chain, the modeller should aim to re-use “less specific” lower level models that will satisfy the objectives of the study.
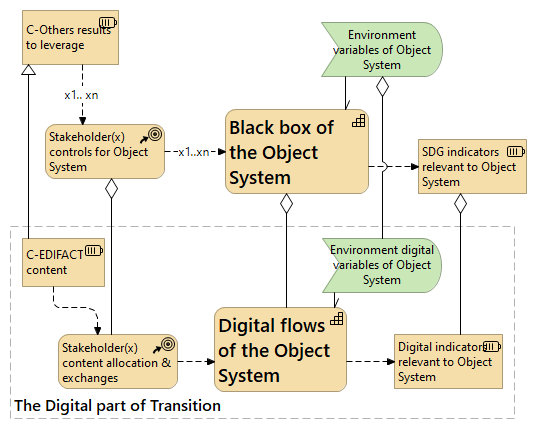
For example, for the information exchanges in a supply chain, the EDIFACT messages can serve as reusable “portfolio models”.
In another example, for the AGV (Automated Guided Vehicle) material handling study, the manufacturing cells that request the AGVs to drop and pick up parts may be modelled as black boxes. Each manufacturing cell can be described with one inter-arrival distribution for AGV pickup requests and another inter arrival distribution for AGV retrieval requests. On the other hand, in a more complex AGV study where there are synchronization issues among the manufacturing cells, one may need to describe in detail the schedule of operations at each cell (Ulgen et al., 1994).
In some cases, lack of time may force the modeller to build a less specific upper level model that satisfies only a subset of the original objectives of the study.
But don’t forget, more detail doesn’t necessarily mean more accuracy!
8.6 - For Larger Initiatives Only
For larger initiatives, additional activities are recommended:
- Estimation of the required resources for the study,
- performing a cost-benefit analysis, and
- the creation of a planning chart.
This e-book doesn’t elaborate these topics in detail. Yet it conjectures that reusing models along the portfolio-program-project-iteration chain, will contribute to substantial economies regarding the required resources, especially if these resources are “open”.
Seen in the perspective of a planet that must achieve the sustainable development goals, any paywalls that hamper the re-use of intellectual resources will harm the cost-benefit equations and complicate the planning of interested parties that should not be left behind.
Estimate the required resources needed to do the study and modeling
Estimating how long an initiative will take and which resources will be used for the study is an important step.
The detailed list of tasks to be performed in the study, the duration of each task, the resources to be used for each task and cost of each resource are needed in order to make a sound estimate of the resource requirements of the initiative. Level of detail and availability of data in the proper form are important factors in determining the time and type of resources required for the study. Availability of historical data from prior initiatives can increase the confidence in the estimates resource levels, timing and cost. A PERT analysis that gives the minimum and maximum duration for each task can be useful in estimating the total initiative time at different levels of confidence.
A special attention should be given to human requirements. Human requirements in a decision making engagement are due to:
- interaction with people familiar in management of the system,
- interaction with people familiar with the engineering details of the system,
- modeller(s) familiar with the modeling tool to be used as well as experience with similar types of systems,
- data collection required by the study.
Perform a Cost-Benefit analysis
This process needs not to be an extended formal process but it should be performed as a check-point in any study.
A simple cost-benefit calculation may also aid the modeller in determining the proper level of detail to include in the model.
For example, for an AGV study, it would be wasteful to spend $20,000 of additional modeling time to decide if faster AGVs are better for the system when the total incremental cost of the faster AGVs is less than $20,000. The team should consider the whole life-cycle of the system and all relevant cost components in the cost-benefit analysis. It is common to observe a cost-benefit ratio of one-hundred to one-thousand from a typical decision making engagement when one looks at the total benefits gained throughout the life of the system (Ulgen et al., 1994).
Create a planning chart of the proposed project
Modeling initiatives can easily get out of hand, especially if the rate of change in the scope of the project exceeds the rate at which the results are available to the interested parties.
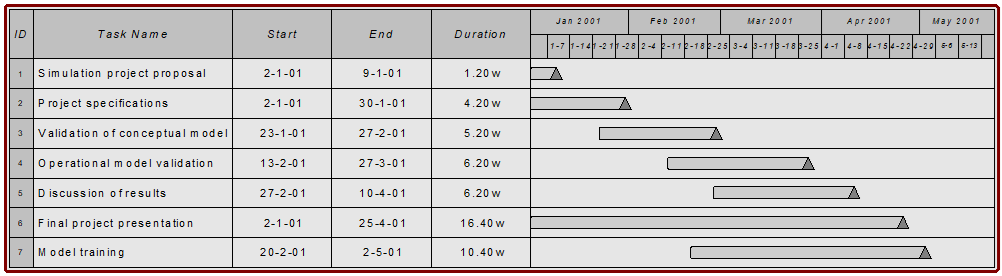
A Gantt chart showing the tasks with milestone points can help control an initiative.
Figure 8.5 shows a Gantt chart for the major phases of a decision making project. Typical milestone events in a simulation project may include completion of the project specifications, CIM model results, input data collection and analysis, base model validation, base model final results, alternate model validation, alternate model final results and final report.
8.7 - Identification and Validation in Open Portfolios
The 2030 Agenda for Sustainable Development - #SDGs
As open portfolios don’t have a competitive or “self-enrichment” intention, the notion of Economic Added Value that is key in micro journeys is subordinate to the values that are depicted in Figure 4.5 and have been defined in the 2030 Sustainable Development Agenda.
In Figure 4.7, the sustainable development goals are linked to the values. The Sustainable Development Goals are strategic objectives for the United Nations member states. Each goal has a number of targets for which also indicators have been defined and data are being collected.
The third component of the 2030 Agenda decision framework are the decision variables. These are not specified in the 2030 Agenda itself, but are addressed in the Addis Ababa Action Agenda and in the national action plans of the UN Member States and the private sector.
One way of describing the decision variables is via variations in the production and consumption of products and services, as classified in the Central Product Classification (CPC), and as produced and delivered by:
- the economic activities as classified in the International Standard Industrial Classification of All Economic Activities, Rev.4 and
- the functions of government as classified in the Classification of the Functions of Government (COFOG).
A myriad of problem statements can be created using this generic decision frame, and both government agencies, industry bodies, and private sector players can launch portfolios, programs, projects and iterations to solve the identified problems.
Each interested party can activily work at one or a few problems, where each problem is addressed in a portfolio, program, project or iteration by a dedicated consortium, network or community.
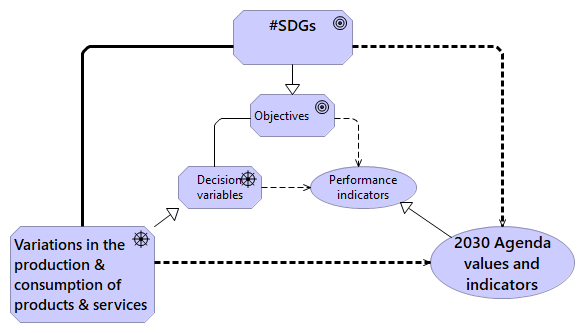
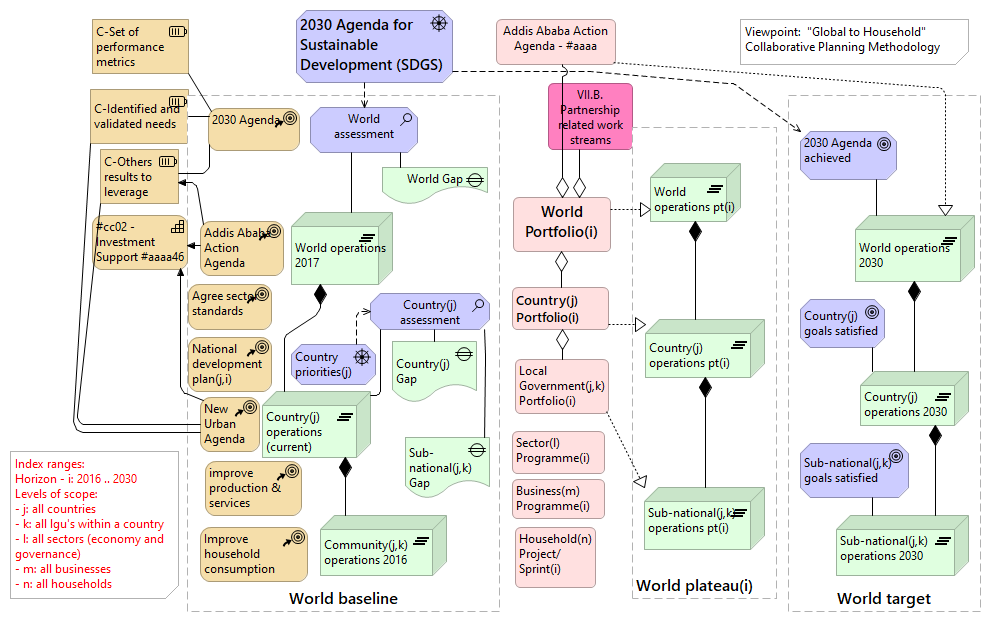
Figure 8.6 shows the decision frame of the 2030 Agenda, and Figure 8.9 shows business, sociological, political and technological trends that should be considered in the planning.
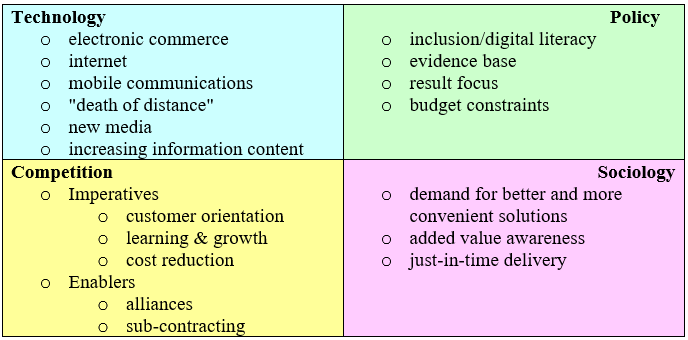
That there are many interested parties, many problems as well as many potential solutions, justifies an open communication strategy, for instance as proposed in the #tagcoding handbook and its translations.
It is clear that solving problem messes at this scale involves many parties that otherwise might freely select values and objectives serving either private or public interest, within the constraints of government regulations (and their resource endowments).
The question then rises for whom the decision frame is valid. Corporate objectives such as maximizing shareholder value reflect the believe that the public interest is best served by every individual pursueing private property growth in a free market. Free market then means a market that is not constrained by any but basic rules, such as specified in contracts.
Regarding the 2030 Agenda validation, its adoption at the UN General Assembly of 2015 indicates a willingness to invest across levels of government. Moreover during the 2030 Agenda’s preparation and in the Addis Ababa Action Agenda much attention was given to a Global Partnership that should engage National governments of all countries, Local authorities, International institutions, Business, Civil society organizations, Philanthropists, Social impact investors, Scientists and academics, People – all sitting at the table to go beyond aid to discuss a truly international framework of policies to achieve sustainable development.
EDIFACT
The United Nations Centre for Trade Facilitation and Electronic Business (UN/CEFACT is a subsidiary, intergovernmental body of the United Nations Economic Commission for Europe (UNECE) which serves as a focal point within the United Nations Economic and Social Council for trade facilitation recommendations and electronic business standards. It has global membership and its members are experts from intergovernmental organizations, individual countries’ authorities and also from the business community.
Its key areas of work include Trade Facilitation Recommendations. Over the past 40 years, the United Nations Economic Commission for Europe (UNECE) has developed and maintained a series of recommendations and standards for international trade. These reflect best practices in trade procedures and data and documentary requirements. They are used worldwide to simplify and harmonize international trade procedures and information flows.
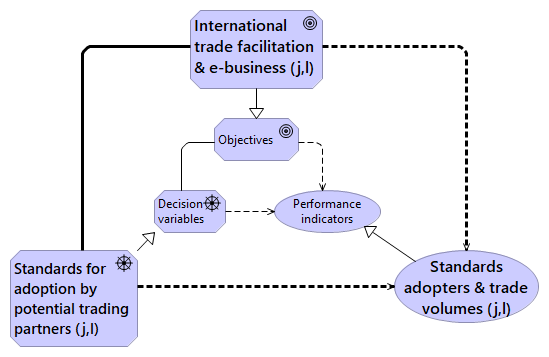
The key open portfolio problem is to extend the standard offer to more sectors (index l in Figure 8.8).
8.8 - Identification and Validation in Programs
Limit to programs that are aware of open portfolio and intend to maximally re-use the resources provided (ref. Figures 5.8 and 5.9):
- by including objectives, measures and indicators in their decision frames;
- by adopting the standards in their analysis and solution design.
- ….
8.9 - Identification and Validation in Projects
Limit to projects that are aware of open portfolio and intend to maximally re-use the resources provided (ref. Figures 5.8 and 5.9):
- by including objectives, measures and indicators in their decision frames;
- by adopting the standards in their analysis and solution design.
- ….
8.10 - Identification and Validation in Iterations
Limit to iterations that are aware of open portfolio and intend to maximally re-use the resources provided (ref. Figures 5.8 and 5.9):
- by including objectives, measures and indicators in their decision frames;
- by adopting the standards in their analysis and solution design.
- ….
8.11 - Identification and Validation in the 2030 Agenda
To the case overview - To the chapter
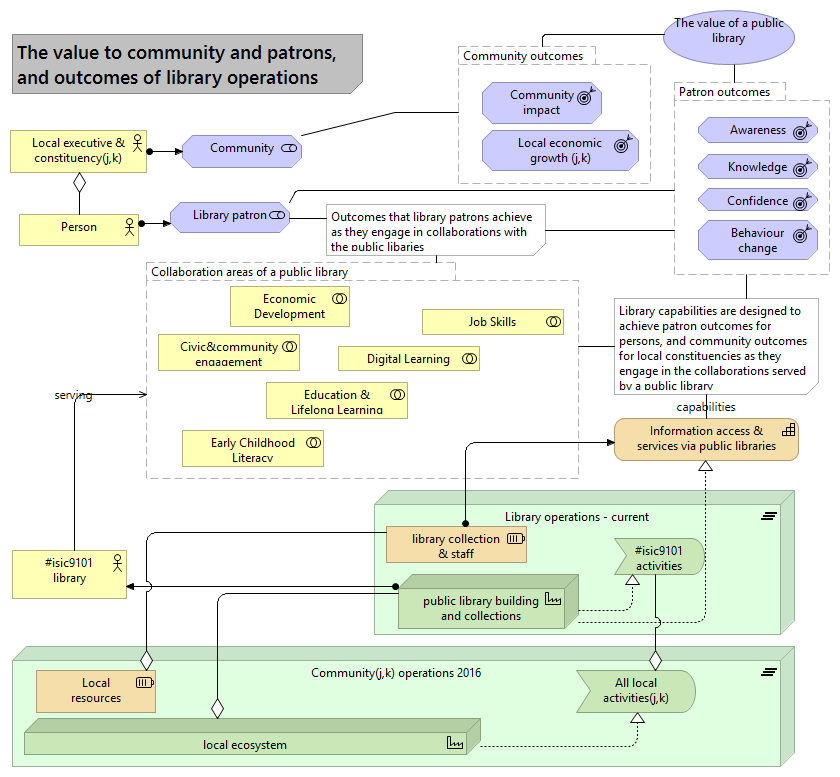
8.12 - Identification and Validation for Library Services
Library services globally must respond to new trends in development and technology.
The local public library must become an (internet-based) capability for all people (citizens), business, and government agencies (local authorities), to easily find and access printed or online content (both creative works and digital public goods) in their native, second or third language. This content will be of interest to their culture, recreation, learning or coping in a sustainable and inclusive manner with the livelihood challenges and opportunities they face.
In the creation of this capability, there is a role for:
- all librarians, as well as for library patrons and many other library stakeholders.
- providers of digital public goods
Figure 8.9 shows critical resources, e.g. “Library collection”, stakeholders, e.g. “Library patron”, alongside the pursued capability and possible courses of action (decision variables) for enhancing the library services.
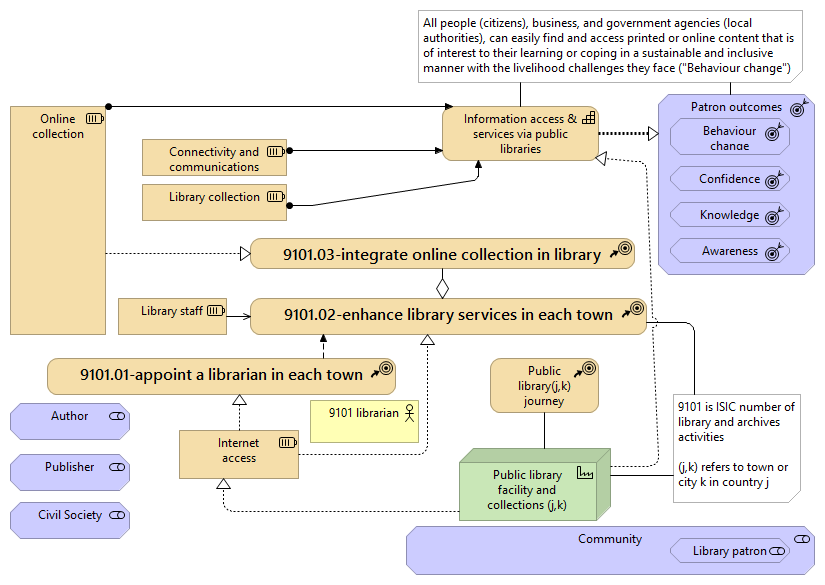
Regarding the availability of local library services (performance measures), note that the #WWlgu pages of local governments include links to “local” open data provided by Knoema as well as links to LibWeb - Library Servers via WWW.
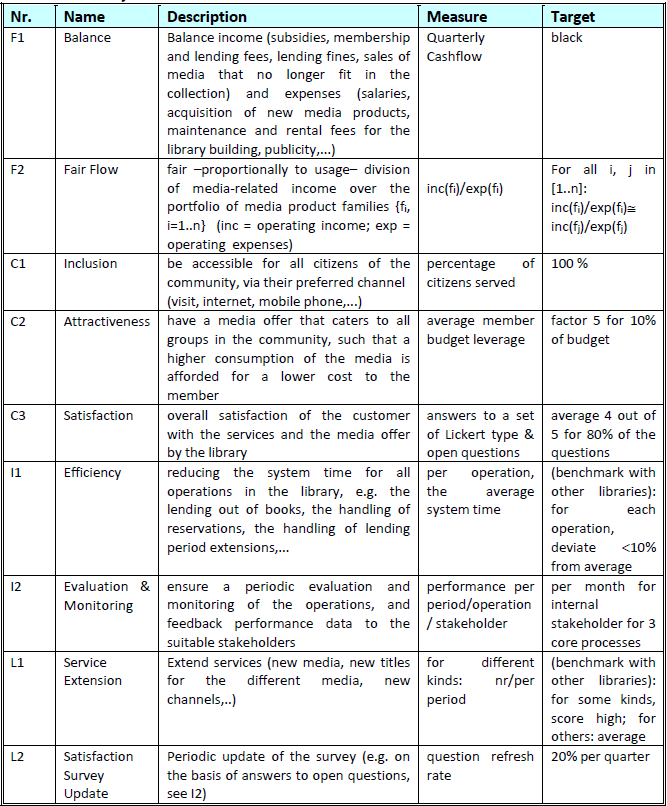
In the Nr. column these abbreviations are used for the objectives: F: Financial; I: Internal business processes; C: Customers; and L: Learning and growth.
To the case overview - To the chapter
8.13 - Identification and Validation at a Petrol Station
Problem Formulation
The decision frame is:
- Objective: minimal number of customers driving on because there is no place in the queue area;
- Performance indicator: number of customers driving on without being served;
- Decision variable: the length of the queue area.
Assumptions that may need attention when agreeing the problem formulation include:
- customers will not get fed up with waiting, for instance in a long queue
- all customers that enter the queue will wait until they have been serviced
- sales revenue will be higher when less customers drive on
There is no data about the cost of enlarging the queue area, nor about the revenue increases that could be gained.
Research Questions
- What is in the current situation the percentage of people that leave without being served?
- What is the average waiting time of served customers for different capacities of the queue area?
- What is the influence of the queue capacity on the percentage of cars leaving without being served?
Scope and Level of Detail
The pumps with service start and service end events.
The queue area with arrival, departure, and service start events.
The cars with the events matching the queue area and pump events.
The decision of the car to drive on when it finds the queue area full.
To the case overview - To the chapter
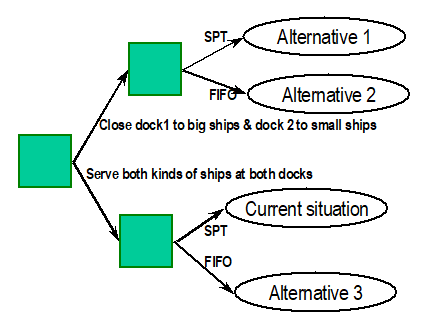
8.14 - Identification and Validation at the Harbour
Problem Formulation
The decision frame is:
- Objective: reduce mean expected throughput time
- Performance indicator: mean expected throughput time;
- Decision variable: queueing discipline; resource allocation strategy
The problem is to evaluate the impact of the decision options on the mean expected throughput time.
Research Questions
- Does closing Dock1 to Big Ships and Dock2 to Small Ships improve the mean expected throughput time of ships at the harbour?
- Is it better to use FIFO rule instead of SPT rule?
Scope and Level of Detail
The docks with service start and service end events.
The queue with arrival, change queue and service start events.
The ships with the events matching the queue and dock events.
To the case overview - To the chapter
Chapter 9 - Research & Leverage in the Technotope
9.1 - Identifying external experiences
9.2 - Open portfolios as external experiences
9.3 - Scope and variables in Programs
9.4 - Scope and variables in Projects
9.5 - Scope and variables in Iterations
9.6 - #CPIM02a in Case 1 - 2030 Agenda
9.7 - #CPIM02a in Case 2 - Library services
9.8 - #CPIM02a in Case 3 - The Petrol Station Case
9.9 - #CPIM02a in Case 4 - The Harbour Case
To Part I (Chapter 1 - 2 - 3 - 4) _ II (5 - 6 - 7) _ III (8 - 9 - 10 - 11 - 12 - (no 13)) _ IV (14 - 15) _ V (Annexes) _ VI (References)
Introduction
The activity black box and assumptions must be expressed. In most cases it is necessary to also list the decision options that will be evaluated (number of models and the techniques used to evaluate them). A decision tree is used to organize all the decision options and their order. If modeling or simulation is required, a modeling or simulation tool must be selected as well.
9.1 - Identifying external experiences for a work system
Given a problem formulation by means of a decision framework, and in reference to a results framework, the next step is to clarify the scope of the work system using a black box notation, and assumptions.
Black Box and Assumptions
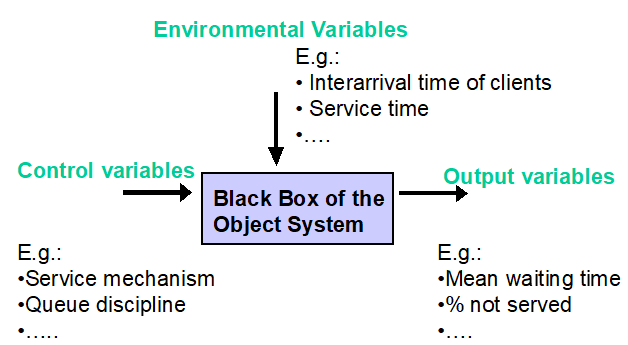
To simulate the system we need input variables. There are two types of input variables:
- Environmental variables: Variables we can’t modify and that are a result of the environment of the system.
- Control variables: Variables we can control or change.
Using these variables, the running simulation and the behaviour of the system can be analyzed considering the output variables.
In this step, the problem and objectives of the decision making engagement are formulated as concretely as possible. The desired reliability and accuracy of the decision making engagement results should also be defined here.
- Reliability is the confidence level at which the results should be displayed. Example: we would like to obtain the average throughput time with a confidence level of 95%.
- Accuracy is the number of decimals at which we would like to display the results. Example: for time measures, we need to know if results will be displayed in hours, minutes, seconds, etc.
These steps must be performed:
- Determine the environmental, control and output variables of a system in its black box representation (Figure 9.1).
- List and finalize the assumptions. Which components of the real system will be excluded, included as a black box, included in moderate detail, or included in fine details is decided at this step.
It is important to keep a formal list of assumptions throughout the study, starting at the design phase, since the scope of work and the micro level assumptions to be made in model building will depend on them. These assumptions should be kept in mind all through the process and included in the final report. A trap which many modellers may fall into is waiting until the end of the study to record their assumptions; by then, they may have forgotten many of them and wasted a lot of time in inadvertently changing the scope of work throughout the process.
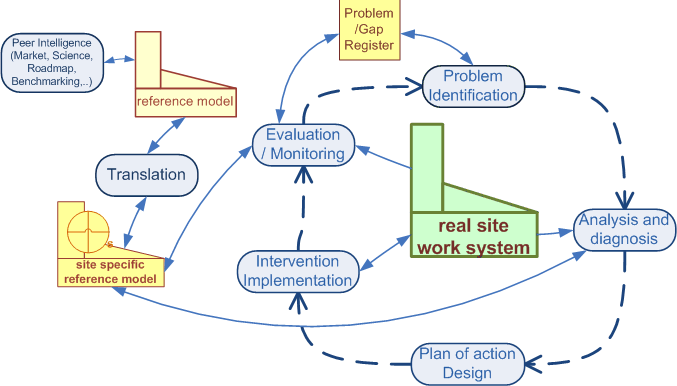
Regulative Cycle extended with Reference Models
The research & leverage is focussed at improving a work system under consideration.
Where research should lead to problem-solving or practical interventions (Goossenaerts et al., 2007), there is often a need for the process of multi-methodology, that is, combining together several methods in an intervention (Mingers, 2003). Originating in psychological practice, the regulative cycle (Van Strien, 1997) has been extensively applied also as a methodology of practice, geared towards the “interested” regulation of the behaviour of groups or organizations in the desired direction. Where principals are engaged with the operations and improvement of a work system such as a plant, a hospital or a service system, the cycle includes the following activities:
- evaluation (of system operations with respect to an instrument or via benchmarking),
- problem identification (selection from a problem mess),
- diagnosis (of the problem situation – analysis),
- plan of action (design), and
- intervention (implementation).
This last step is again followed by evaluation to close the cycle.
In the evaluation activity it is convenient to have an instrument to compare the performance or structure of the work system. The reference fab methodology (Plieninger et al., 2001) uses a reference model for systematic target setting on high level performance indicators.
The model obtained from peer intelligence is translated into a site specific reference model with targets for the actual site work system. The translation considers factor costs, volumes and complexity of technologies.
Where open portfolios, programs and projects involve digital components, some form of concertation of the regulative cycles is recommended. Model-based analysis and development (Berre et al, 2004-2007) and the sharing model repositories can help reduce common project risks (Goossenaerts, 2004). Where a trend to many-to-many relationships is observed (Elgarah et al, 2005), lock-in strategies by software vendors, and free-rider attitudes and prisoner’s dilemma by OEM and their customers may delay achieving solution flexibility, perpetual service-IT alignment, as well as affordable development and implementation costs. A complicating factor in deciding on investments in the digitally enabled constellations is the imitable nature of the standards, architectures, contracts and services that must be deployed. In economic theory, the relevant game is the public good game, a multi-player variant of the prisoner’s dilemma (Fehr and Schmidt, 1999).
In an open portfolio, the purpose of this step is to identify external organizations and service providers that may have already met, or are currently facing needs similar to the ones identified in #CPIM01 - Identify and validate, and then to analyse their experiences and results to determine if they can be applied and leveraged or if a partnership can be formed to address the needs together.
In alignment with “Shared First” principle, it is at this point that the planners consult both internal and external service catalogues for pre-existing services that are relevant to the current needs. In some instances, an entire business model, policy, technology solution, or service may be reusable to address the needs defined in #CPIM01 - Identify and validate – an important benefit in these cost-constrained, quickly evolving times.
Based on this analysis, leadership and stakeholders determine whether or not they will be able to leverage the experiences and results from other organizations in their projects, programs or portfolios.
9.2 - Open Portfolios as external experiences
The 2030 Agenda for Sustainable Development - #SDGs
The 2030 Agenda decision framework and related performances are to serve as catalyst for sharing experiences and results among diverse partners.
In a sense they provide a decision framework.
Consider a current need, expressed as a gap with respect to a sustainable development goal or target for the system’s outcome.
When allocating the goals to sectors of industry and functions of government, and comparing performances of thoses sectors and functions in other countries or constellations with those of the problem owner, options for leveraging those experiences would often exist.
One way of describing the decision variables is via variations in the production and consumption of products and services, as classified in the Central Product Classification (CPC), and as produced and delivered by:
- the economic activities as classified in the International Standard Industrial Classification of All Economic Activities, Rev.4 and
- the functions of government as classified in the Classification of the Functions of Government (COFOG).
A myriad of problem statements can be created using this generic decision frame, and both government agencies and private sector players can launch portfolios, programs, projects and iterations to solve the problems.
Each interested party can activily work at one or a few problems, while ensuring that effort is wisely divided over a feasible range of programs, projects and iterations for a selection of economic activities and functions of government such that “landscape wide” progress can be guaranteed.
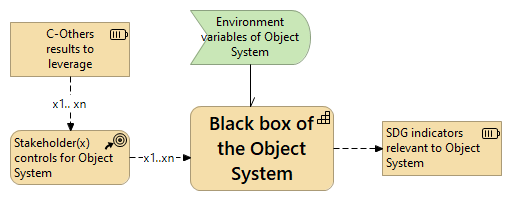
Figure 9.3 shows the black box of the 2030 Agenda.
The 2030 Agenda for sustainable development faces at least these three systemic challenges, for which the OECD has proposed Principles on Effective Public Investment across Levels of Government:
- Co-ordination across governments and policy areas
- 01 - Adopt an integrated, place-specific strategy
- 02 - Co-ordinate across sub-national and national levels
- 03 - Invest at the relevant scale
- The strengthening of capacities for public investment and the promotion of learning
- 04 - Understand impacts and risks
- 05 - Engage stakeholders at every step
- 06 - Include private actors and institutions
- 07 - Build expertise in local partners
- 08 - Focus on results, capture lessons from experience
- Ensure sound framework conditions at all levels of governments
- 09 - Develop a fiscal framework aligned with objectives
- 10 - Insist on sound, transparent financial management
- 11 - Promote strategic use of public procurement
- 12 - Strive for consistent, quality regulation
The key open portfolio problem is to convince all the interested parties in investing towards the objectives of the 2030 Agenda.
EDIFACT
To enhance and facilitate international trade UN/CEFACT addresses these topics:
- Code List Recommendations: Codified information is an integral part of data exchange in international business whether this is on paper documents or electronic data exchange. The United Nations Economic Commission for Europe (UNECE), through its UN Centre for Trade Facilitation and Electronic Business (UN/CEFACT) develops, maintains and publishes for free of charge a number of code lists used extensively in business transactions.
-
Standards ranging from general, supply chain management and transport and logistics to environment and covering sectors such as Agriculture, Travel and Tourism and Accounting and Audit. Key standards include:
- UN/LOCODE: The “United Nations Code for Trade and Transport Locations” is commonly more known as “UN/LOCODE”. Currently, UN/LOCODE includes over 103,034 locations in 249 countries and territories. UN/LOCODE is used by most major shipping companies, by freight forwarders and in the manufacturing industry around the world. It is also applied by national governments and in trade related activities, such as statistics where it is used by the European Union, by the UPU for certain postal services, etc.
- UN/EDIFACT: The United Nations rules for Electronic Data Interchange for Administration, Commerce and Transport (UN/EDIFACT) comprise a set of internationally agreed standards, directories, and guidelines for the electronic interchange of structured data, between independent computerized information systems.
- BSP-RDM: The objective of this Buy-Ship-Pay Reference Data Model (BSP-RDM) is to describe the requirements for a generic Reference Data Model (RDM), generalizing the concepts of the Multi-Modal Transport Reference Data Model (MMT-RDM) and the Supply Chain Reference Data Model (SCRDM), leading to the development,publishing and improving the maintenance of a Business Standard, which can be applied by country and regional administrations and industries.
9.3 - Scope and variables in programs
Limit to programs that are aware of open portfolio and intend to maximally re-use the resources provided (ref. Figure 9.3, 9.4 and 9.5):
- by including objectives and indicators in their decision frames;
- by adopting the standards in their analysis and solution design.
- ….
9.4 - Scope and Variables in Projects
9.5 - Scope and Variables in Iterations
9.6 - Scope and Variables in the 2030 Agenda
To the case overview - To the chapter
9.7 - Scope and Variables of Library Services
A library is a large collection of books, and can refer to the place in which the collection is housed. Today, the term can refer to any collection, including digital sources, resources, and services. The collections can be of print, audio, and visual materials in numerous formats, including maps, prints, documents, microform (microfilm/microfiche), CDs, cassettes, videotapes, DVDs, video games, e-books, audiobooks and many other electronic resources.
In the International Standard Industrial Classification of All Economic Activities, Rev.4 the activities of libraries are included in #isic9101 - Library and archives activities, and include:
- documentation and information activities of libraries of all kinds, reading, listening and viewing rooms, public archives providing service to the general public or to a special clientele, such as students, scientists, staff, members as well as operation of government archives:
- organization of a collection, whether specialized or not
- cataloguing collections
- lending and storage of books, maps, periodicals, films, records, tapes, works of art etc.
- retrieval activities in order to comply with information requests etc.
- stock photo libraries and services
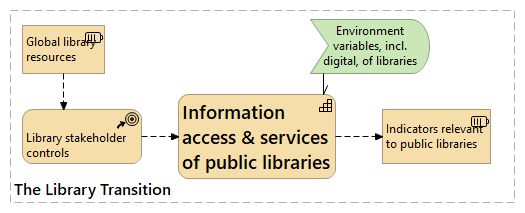
The work system pattern in Figure 9.7 illustrates the wide range of control and environmental variables and indicators that may be considered in the transition of public library services.
To the case overview - To the chapter
9.8 - Scope and Variables in the Petrol Station Case
In this case, we assume no external experiences can be relied upon. We follow the steps explained in chapter 9.1.
The Black Box Representation
The input variables are:
- Environmental variables:
- the interarrival time of cars
- the service time of cars
- Control variables:
- the queue length
- (the number of pumps)
The output variables are:
- the percentage of cars not served
- the mean waiting time

Assumptions and Givens
No data collection is required, as some information is given on the interarrival times and service times.
G1. the interarrival time of cars is expo(4)
G2. the service time of cars is uniform(1,6)
A1. the business operates 24 hours per day; 7 days per week
A2. no defects of the pumps occur
List of assumptions must be maintained as the study (and the Modeling) proceeds, that is why it is convenient to put it in an annex. In real world projects, all assumptions must be approved by the problem owner.
Is Modeling needed?
System:
- Single class system
- No admission control
- One queue (FIFO)
- One server
- in A/B/M/K/N notation: M/G/1/3 system
Are there results available for the M/G/1/3 system? NO!
Can we make any approximation?
Yes: M/M/1/3 system
The Number of Models
There are two models that must be evaluated for the problem owner:
- the current model with queue length 3 (M/G/1/3; by Modeling)
- the situation with longer queue length, e.g. 4, 5 or 6 (M/G/1/4; by Modeling)
In addition, for validating the simulation model, an approximate model will be evaluated by queuing theory, and its results will be compared to a simulation experiment with the same properties.
- the approximate model with queue length 3, and exponentional service times (M/M/1/3; by queuing theory)
- the approximate model with queue length 3, and exponentional service times (M/M/1/3; by Modeling)
To the case overview - To the chapter
9.9 - Scope and Variables in the Harbour Case
In this case, we assume no external experiences can be relied upon. We follow the steps explained in chapter 9.1.
The Black Box Representation
From the objective it is clear that the mean throughput time has to be determined. This is the output variable, which has to be delivered by the observer. In order to deliver this output variable the observer has to record some items within the simulated system.
At the same time attention must be paid to the output variable from the real system: “departing ships”. There are two control variables, namely the dock allocation strategy and the queue discipline. The environmental variables are the interarrival time, service time and the size of the ship.

The input variables are:
- Environmental variables:
- the interarrival time of ships
- the service time of docks for ships
- Control variables:
- the queue discipline
- dock allocation strategy
The output variables are:
- the mean throughput time
Assumptions and Givens
No data collection is required, as some information is given on the interarrival times and service times.
G1 …Gn: …
A1. both docks operate 24 hours per day; 7 days per week A2. no maintenance of the docks is required.
List of assumptions must be maintained as the study (and the Modeling) proceeds, that is why it is convenient to put it in an annex.
Is Modeling needed?
Yes, because changing queues cannot be addressed in analytic models.
For validation purposes, and for determining the number of models, lets simplify as follows:
- dock1 closed to Big ships and dock2 closed to Small ships
- Use simply a FIFO rule instead of the SPT rule?
Then we obtain two separate queuing systems at dock 1 and dock 2 that behave like M/G/1 systems:
- Dock 1, with Intearrival times expo(5.5) and Service time time Uniform(3,7)
- Dock 2, with Intearrival times expo(6.7) and Service time Uniform(2,8)
The Number of Models
For the problem owner four models must be evaluated:
- the current situation with both kinds of ships served at both docks and SPT;
- Alternative 1: where ships must be served in the specialized dock, with SPT;
- Alternative 2: where ships must be served in the specialized dock, with FIFO;
- Alternative 3: with both kinds of ships served at both docks and FIFO as queue discipline.
For three of these models (current, Alternative 1 and 3) Modeling is required.
In addition, for validating the simulation model, Alternative 3 will be evaluated by queuing theory, and its results can be compared to a simulation experiment with the same properties.
To the case overview - To the chapter
Chapter 10 - Define and plan in the Technotope
This chapter is due for a later version, especially also with reference to portfolio, program, project and iteration definition and planning.
Depending on the level of the defining and planning, at play are a different mix of digital principles (Chapter 4):
- #dp1 - Design with people
- #dp2 - Understand the existing ecosystem
- #dp3 - Design for inclusion
- #dp4 - Build for sustainability
- #dp5 - Establish people-first data practices
- #dp6 - Create open and transparent practices
- #dp7 - re-use and improve
- #dp8 - Anticipate and mitigate harms
- #dp9 - Use evidence to improve outcomes
and capabilities (Chapter 5):
- The Future Ready Capability
- The Investment Support Capability
- The Shared Services Capability
- The Interoperability Standards Capability
- The Information Access Capability
- The Security and Privacy Capability
- The Technology Adoption Capability
To Part I (Chapter 1 - 2 - 3 - 4) _ II (5 - 6 - 7) _ III (8 - 9 - 10 - 11 - 12 - (no 13)) _ IV (14 - 15) _ V (Annexes) _ VI (References)
Chapter 11 - Invest and Execute in the Technotope
This chapter is only an early draft.
11.1 - Joint Implementation by Various Actors and Stakeholders
11.2 - Returns of Collaboration in Portfolios and Programs
11.3 - Returns of Collaboration in the Semiotic CPIM Phases
11.4 - Invest and Execute for the 2030 Agenda for Sustainable Development
11.5 - Invest and Execute for Library Services
To Part I (Chapter 1 - 2 - 3 - 4) _ II (5 - 6 - 7) _ III (8 - 9 - 10 - 11 - 12 - (no 13)) _ IV (14 - 15) _ V (Annexes) _ VI (References)
11.1 - Joint implementation by various actors and stakeholders
In this chapter we describe the tools and resources for implementing the 2030 Agenda for Sustainable Development. In this chapter we elaborate the “Societal Architecture customized views” for each stakeholder group with a focus on the reusable input the Societal Architecture provides for their Invest and Execute activities.
An earlier version of the proposed approach was included in A Multi-level Model-driven Project Environment (MMPE) facilitates systematic society-wide re-use of the architecture descriptions models. Building upon a formal approach to system modeling, we emphasize specific model-resources at different levels and explain their impact on change projects and the risks involved (Goossenaerts et al, 2008).
The elaboration of model dependencies that are cross-phase in the regulative cycle, one such cycle could be the TOGAF Architecture Development Method, cross-level in MLP, and cross-layer in the Enterprise Architecture is an original contribution of our work. The allocation of models to the public and proprietary domains is intended to induce fair and concerted growth-focused attitudes (Goossenaerts, 2007).
Stakeholders to consider:
- Citizens and households
- Global Partnership
- Firms
- National Government
- Local Authorities
- Schools
- UN Country Teams
- Publishers and right holders
- Libraries
- Aid and international organizations
11.2 - Returns of Collaboration in Portfolios and Programs
The need for investment from the global to local macro level is clearly expressed in the finance-related Sustainable Development Targets and article 34 on capacities of the Addis Ababa Action Agenda.
Finance related Sustainable Development Targets
- 17.1 Strengthen domestic resource mobilization, including through international support to developing countries, to improve domestic capacity for tax and other revenue collection (#sdt171)
- 17.2 Developed countries to implement fully their official development assistance commitments, including the commitment by many developed countries to achieve the target of 0.7 per cent ODA/GNI to developing countries and 0.15 to 0.20 per cent of ODA/GNI to least developed countries; ODA providers are encouraged to consider setting a target to provide at least 0.20 per cent of ODA/GNI to least developed countries (#sdt172)
- 17.3 Mobilize additional financial resources for developing countries from multiple sources (#sdt173)
- 17.4 Assist developing countries in attaining long-term debt sustainability through coordinated policies aimed at fostering debt financing, debt relief and debt restructuring, as appropriate, and address the external debt of highly indebted poor countries to reduce debt distress (#sdt174)
- 17.5 Adopt and implement investment promotion regimes for least developed countries (#sdt175)
Addis Ababa Action Agenda, Art. 34 “#aaaa34 - Capacities of municipalities and other local authorities”
- We further acknowledge that expenditures and investments in sustainable development are being devolved to the subnational level, which often lacks adequate technical and technological capacity, financing and support (#aaaa34_1)
- We therefore commit to scaling up international cooperation to strengthen capacities of municipalities and other local authorities. We will support cities and local authorities of developing countries, particularly in least developed countries and small island developing States, in implementing resilient and environmentally sound infrastructure, including energy, transport, water and sanitation, and sustainable and resilient buildings using local materials (#aaaa34_2)
- We will strive to support local governments in their efforts to mobilize revenues as appropriate (#aaaa34_3)
- We will enhance inclusive and sustainable urbanization and strengthen economic, social and environmental links between urban, peri-urban and rural areas by strengthening national and regional development planning, within the context of national sustainable development strategies (#aaaa34_4)
- We will work to strengthen debt management, and where appropriate to establish or strengthen municipal bond markets, to help subnational authorities to finance necessary investments (#aaaa34_5)
- We will also promote lending from financial institutions and development banks, along with risk mitigation mechanisms, such as the Multilateral Investment Guarantee Agency, while managing currency risk (#aaaa34_6)
- In these efforts, we will encourage the participation of local communities in decisions affecting their communities, such as in improving drinking water and sanitation management (#aaaa34_7)
- By 2020, we will increase the number of cities and human settlements adopting and implementing integrated policies and plans towards inclusion, resource efficiency, mitigation and adaptation to climate change and resilience to disasters (#aaaa34_8)
- We will develop and implement holistic disaster risk management at all levels in line with the Sendai Framework (#aaaa34_9)
- In this regard, we will support national and local capacity for prevention, adaptation and mitigation of external shocks and risk management (#aaaa34_10)
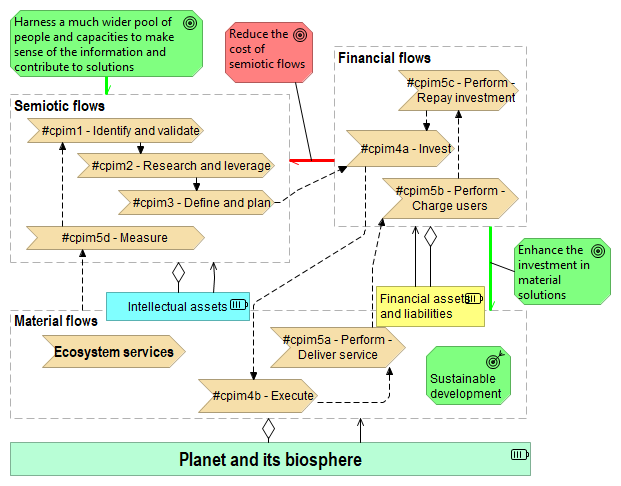
Shifting Investments
Considering that in the international development landscape a lot of investments are allocated to (expensive) knowledge work that is focused on the semiotic flows the intended impact of the Societal Architecture is threefold as depicted in Figure 11.1:
- To reduce the cost of semiotic flows;
- To enhance the investment in material solutions; and
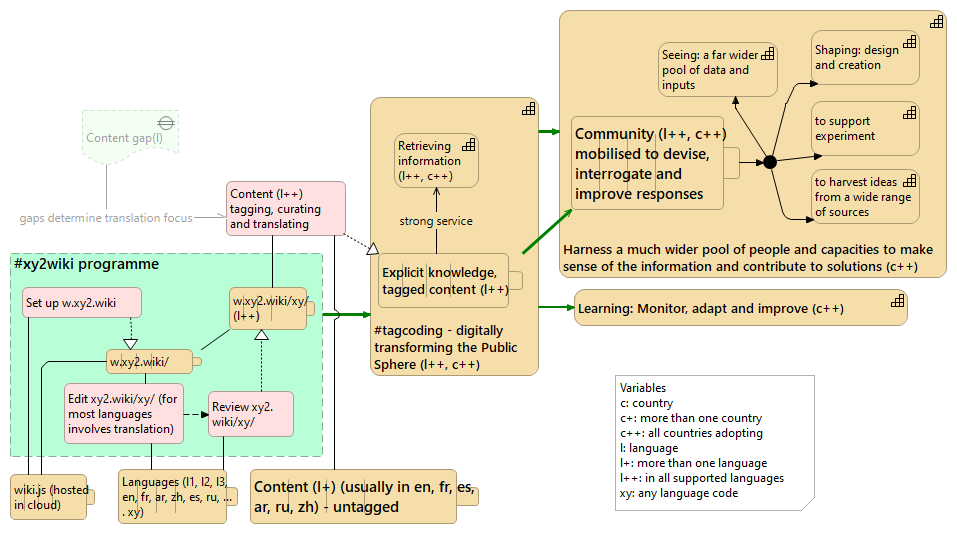
- Harness a much wider pool of people and capacities to make sense of the information and contribute to (material) solutions.
The goal of harnessing a much wider pool of people and capacities to make sense of the information and contribute to (material) solutions is moreover served by #tagcoding and #xy2wiki as depicted in Figure 11.2 that also clarifies the related building up of capabilities.
11.4 - Returns of Collaboration in the Semiotic Phases
For the scope of semiotic phases, see Chapter 4.3 Re-use of Knowledge Assets in Decision Support Studies.
Content in this chapter will be based on Knowledge conversion.
- Landscape models for public-private monitoring, review and validation and sectoral partial models that are aligned with the Sustainable Development Goals and open domain models.
- Reduced risks of stranded resources.
- Identifying commonalities across countries, municipalities and languages as illustrated in Invest and Execute for Library Services.
11.4 - Invest and Execute for the 2030 Agenda
Content in this chapter will be based on Initiative Management - Use evidence to improve outcomes - #dp9
To the case overview - To the chapter
11.5 - Invest and Execute for Library Services
It is important that each town (k) in each country (j) of the world has a local public library (j,k) journey towards providing #cpc8451 - Library services in the languages spoken in the town.
Each language has an ISO-639 code, and this code is used to distinguish the (online) library activities, for instance #cpc8451hi for library services providing content in Hindi.
Depending on the current status of the library services in a language or town, priority initiatives can be selected from below tasks:
- #isic910101 - appoint a librarian for each language or in each town
- #isic910102 - enhance library services in each town
- #isic910103 - integrate the world’s online collection in the local library
- #isic910104 - ensure local content is discoverable in the world’s online collection
Google Translate is an important enabler for the integration of the world’s online collection in local libraries. The languages that are supported in Google Translate are depicted in Figure 11.3. For each language, the linked page contains information such as the number of speakers and the countries where the language is spoken.
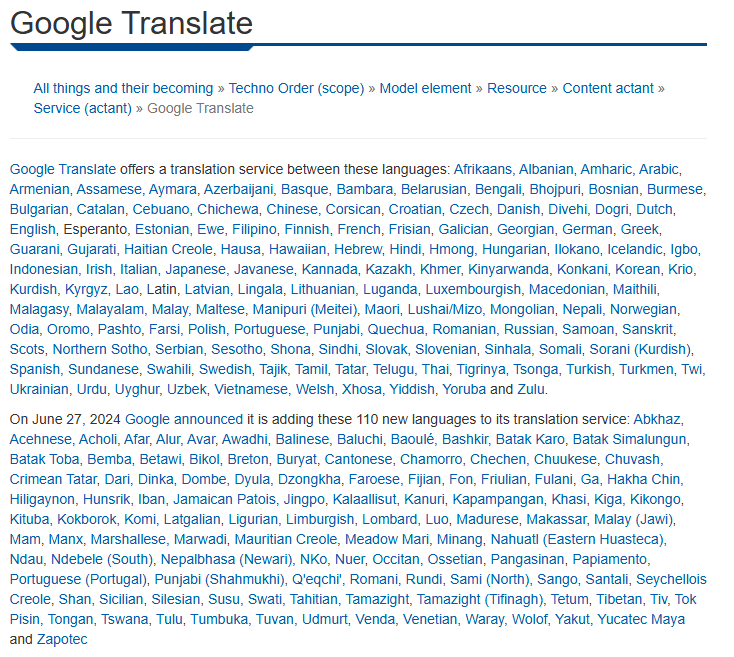
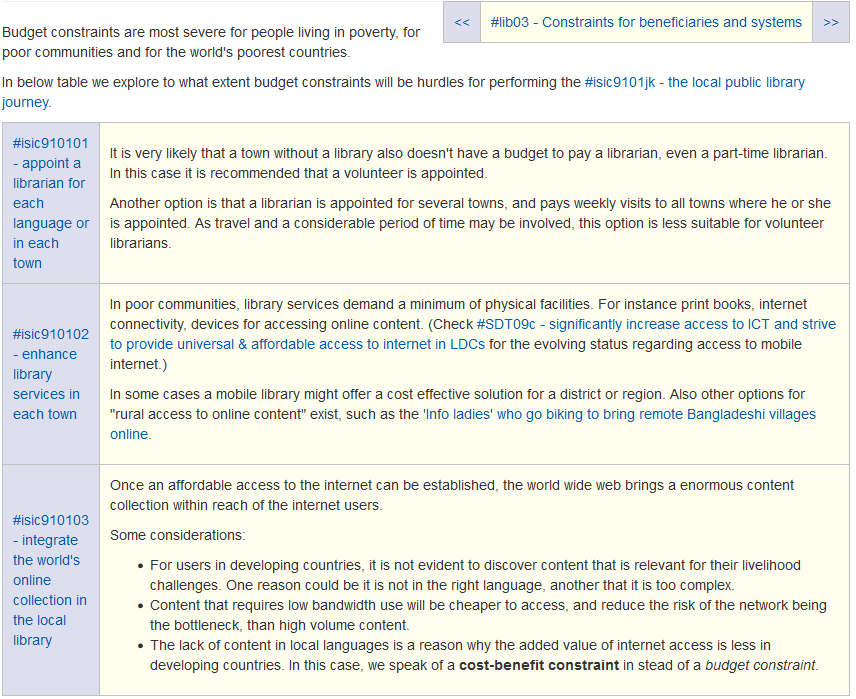
Figure 11.4 shows some constraints for beneficiaries and systems that have to be taken into consideration.
To the case overview - To the chapter
Chapter 12 - Perform and Measure in the Technotope
This chapter must still be written. This area of work is well covered in operations management and by the work of international organizations and national statistics organizations.
Emphasis on general Principles for collaborative performance and measurement in the 2030 Agenda Partnership and the role of National Statistics Organizations.
12.1 - Performance and Joint Measurement for the various Actors and Stakeholders
12.2 - Returns of Collaboration in Operations and Measurement
12.3 - Perform and Measure in Open Portfolios
12.4 - Perform and Measure in Programs
12.5 - Perform and Measure in Projects
12.6 - Perform and Measure for the 2030 Agenda
12.7 - Perform and Measure for Library Services
To Part I (Chapter 1 - 2 - 3 - 4) _ II (5 - 6 - 7) _ III (8 - 9 - 10 - 11 - 12 - (no 13)) _ IV (14 - 15) _ V (Annexes) _ VI (References)
12.1 - Performance and Joint Measurement for the Various Actors and Stakeholders
In this chapter we describe the “Societal Architecture customized views” for Joint performance and measurement for each stakeholder group with reference to the reusable input the Societal Architecture provided for their Identify and validate, Research and leverage, and Define and plan activities.
An earlier version of the proposed approach was included in A Multi-level Model-driven Project Environment (MMPE) which facilitates systematic society-wide re-use of the architecture descriptions models (Goossenaerts et al., 2009). Building upon a formal approach to domain modeling, we emphasize specific model-resources at different levels and explain their impact on change projects and the risks involved.
The elaboration of model dependencies that are cross-phase in the regulative cycle (van Strien, 1997), one such cycle could be the TOGAF Architecture Development Method, cross-level in multi-level planning, and cross-layer in the Enterprise Architecture is an original contribution of our work. The allocation of models to the public and proprietary domains is intended to induce fair and concerted growth-focused attitudes (Goossenaerts, 2007).
12.2 - Returns of Collaboration in Operations and Measurement
What are the benefits of cross-level collaboration in operations and measurement?
12.3 - Perform and Measure in Open Portfolios
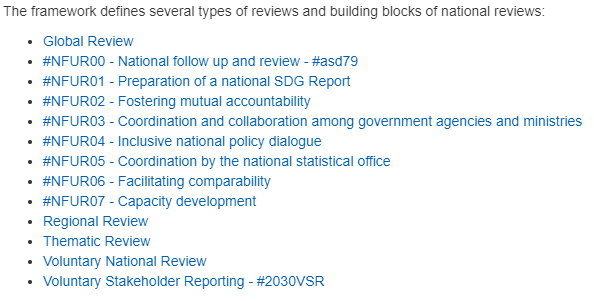
This chapter will source from work on the 2030 Agenda Review Framework.
12.4 - Perform and Measure in Programs
12.5 - Perform and Measure in Projects
This chapter will source from work on the UN Global Compact Strategy 2021-2023 and the UN Global Compact’s reporting framework.
Over 66,000 Communications on Progress (COP) are available from the international Global Compact database.
12.6 - Perform and Measure for the 2030 Agenda
See Perform and Measure in Open Portfolios.
To the case overview - To the chapter
12.7 - Perform and Measure for Library Services
To the case overview - To the chapter