Manipulating data
How to use data imported from a csv file with spaces in the header.
When importing data from a csv file that has headers with spaces in the middle of some of the fields there is a need to address the data slightly differently in order for it to be used easily in your JavaScript.
For example the following csv data has a column named ‘Date Purchased’;
Value,Date Purchased,Score
12345,2011-03-23,99
22345,2011-03-24,100
32345,2011-03-25,99
42345,2011-03-26,100
This is not an uncommon occurrence since RFC 4180 which specifies csv content allows for it and d3.js supports the RFC;
Within the header and each record, there may be one or more fields, separated by commas. Each line should contain the same number of fields throughout the file. Spaces are considered part of a field and should not be ignored.
When we go to import the data using the d3.csv function, we need to reference the ‘Data Purchased’ column in a way that makes allowances for the space. The following piece of script (with grateful thanks to Stephen Thomas for answering my Stack Overflow question) appears to be the most basic solution.
d3.csv("sample-data.csv", function(error, data) {
    data.forEach(function(d) {
        d.date = parseDate(d['Date Purchased']);
    });
...
});
In the example above the ‘Date Purchased’ column is re-declared as ‘date’ making working in the following script much easier.
Extracting data from a portion of a string.
The example problem here would be as if we have a set of values in a string that we want to extract but which in their original form it would not be possible.
For example, the following csv file contains the column ‘value’ and the values of the data in that column are prefixed with a dollar sign ($).
value,date,score
$1234,2011-03-23,99
$2234,2011-03-24,100
$3234,2011-03-25,99
$4235,2011-03-26,100
We can use the JavaScript substring() method to easily remove the leading character from the data.
The following example processes our csv file after loading it and for each ‘value’ entry on each row takes a substring of the entry that removes the first character and retains the rest.
d3.csv("sample-data.csv", function(error, data) {
    data.forEach(function(d) {
        d.value = +d.value.substring(1);
    });
...
});
The substring() function includes a ‘start’ index (as used above) and optionally a ‘stop’ index. More on how these can be configured can be found on the w3schools site.
Grouping and summing data (d3.nest).
Often we will wish to group elements in an array into a hierarchical structure similar to the GROUP BY operator in SQL (but with the scope for multiple levels). This can be achieved using the d3.nest operator. Additionally we will sometimes wish to collapse the elements that we are grouping in a specific way (for instance to sum values). This can be achieved using the rollup function.
The example we will use is having the following csv file consisting of a column of dates and corresponding values;
date,value
2011-03-23,3
2011-03-23,2
2011-03-24,3
2011-03-24,3
2011-03-24,6
2011-03-24,2
2011-03-24,7
2011-03-25,4
2011-03-25,5
2011-03-25,1
2011-03-25,4
We will nest the data according to the date and sum the data for each date so that our data is in the equivalent form of;
key,values
2011-03-23,5
2011-03-24,21
2011-03-25,14
We will do this with the following script;
d3.csv("source-data.csv", function(error, csv_data) {
	var data = d3.nest()
		.key(function(d) { return d.date;})
		.rollup(function(d) {
			return d3.sum(d, function(g) {return g.value; });
		}).entries(csv_data);
...
});
We are assuming the data is in the form of our initial csv file and is named source-data.csv.
The first thing we do is load that file and assign the loaded array the variable name csv_data.
d3.csv("source-data.csv", function(error, csv_data) {
Then we declare our new array’s name will be data and we initiate the nest function;
var data = d3.nest()
We assign the key for our new array as date. A ‘key’ is like a way of saying “This is the thing we will be grouping on”. In other words our resultant array will have a single entry for each unique date value.
.key(function(d) { return d.date;})
Then we include the rollup function that takes all the individual value variables that are in each unique date field and sums them;
		.rollup(function(d) {
			return d3.sum(d, function(g) {return g.value; });
Lastly we tell the entire nest function which data array we will be using for our source of data.
}).entries(csv_data);
What if your data turns out to be unsorted? Never fear, we can easily sort on the key value by tacking on the sortKeys function like so;
.key(function(d) { return d.date;}).sortKeys(d3.ascending)
You should note that our data will have changed name from date and value. This is as a function of the nest and rollup process. But never fear, it’s a simple task to re-name them if necessary using the following function (which could include a call to parse the date, but I have omitted it for clarity);
data.forEach(function(d) {
	d.date = d.key;
	d.value = d.values;
});
Padding for zero values
The ‘Padding for zero values’ question is one that I posted on Stack Overflow in April 2014.
The premiss is that I want to be able to graph points in a time series that has regular intervals but where some of those intervals are missing. For example a line graph of the following data (notice that August 2013 is missing)…
date,value
2013-01,53
2013-02,165
2013-03,269
2013-04,344
2013-05,376
2013-06,410
2013-07,421
2013-09,376
2013-10,359
2013-11,392
2013-12,433
2014-01,455
2014-02,478
… would produce a graph that looked like the following
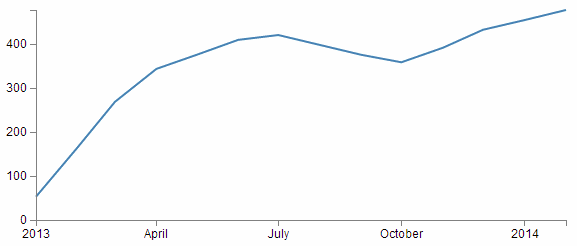
But if the reason for the missing August month was that the value would have been zero, then the graph should actually look like this;
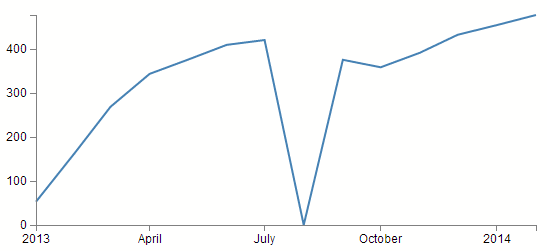
Now, this may sound like a contrived example, but I have come across it in cases where querying for data from a MySQL database by counting (COUNT(*)) the number of instances of an event in a time series (number of sales of an individual item on a monthly basis for instance). The end result is that you are left with a list of months with values for those months where sales occurred, but where no sales occurred, there is no result at all. This can be overcome by some serious MySQL-fu or PHP trickery, but every solution I implemented had a ‘cracking a walnut with a sledgehammer’ feel about it.
Now I know that shifting the resolution of this problem from the server to the client might not sit well for everyone, but that doesn’t mean it’s not a suitable solution.
The solution that was provided by the user ‘explunit’ has a nice natural feel to it and in spite of introducing an additional JavaScript library to load (Lo-Dash) it’s a solution that I will be using in the future for this type of problem. You will need to bear in mind that the lodash.js library will need to be loaded to enable this solution.
<script src=
  "http://cdnjs.cloudflare.com/ajax/libs/lodash.js/2.4.1/lodash.min.js">
</script>
Lo-Dash
Lo-Dash is a utility JavaScript library released under the MIT license that provides a range of useful functional programming helpers such as low level functions that can be used for iteration support for arrays, strings, objects, and arguments objects. It is often compared to underscore.js in terms of functionality.
_.find
_.find(collection, [callback=identity], [thisArg])
The ` _.find` function iterates over elements of a collection, returning the first element that the callback returns ‘truey’ for. The callback is bound to thisArg and invoked with three arguments; (value, index|key, collection).
If a property name is provided for callback the created “_.pluck” style callback will return the property value of the given element.
If an object is provided for callback the created “_.where” style callback will return true for elements that have the properties of the given object, else false.
Arguments
- collection (Array|Object|string): The collection to iterate over.
-
[callback=identity] (Function|Object|string): The function called per iteration. If a property name or object is provided it will be used to create a “.pluck” or “.where” style callback, respectively. -
[thisArg] (*): The this binding of callback.
The explunit method
The following is the layout of the critical part of the code that the explunit method uses.
var period = d3.time.month; // set the time interval

// Scale the range of the data
x.domain(d3.extent(data, function(d) { return d.date; }))
     .ticks(period);
y.domain([0, d3.max(data, function(d) { return d.value; })]);

// Populate the new array
var newData = x.ticks(period)
               .map(function(monthBucket) {
                   return _.find(data,
                       { date: monthBucket }) ||
                       { date: monthBucket, value: 0 };
                });
It can be thought of as breaking the problem down into two steps. Firstly a new array is built that covers the range of values declared in the data and contains dates at a specified interval. Secondly, the script iterates over the old data and where the date matches a date in the new array it maps the value from the old array to the new array. Where there is no match, it maps the value of 0.
Build the array
scale.ticks([count])
The domain in the x axis is set using the following line;
x.domain(d3.extent(data, function(d) { return d.date; }))
     .ticks(period);
Here the extent of the domain is declared in a standard way (d3.extent(data, function(d) { return d.date; })) but by including the .ticks function the domain is broken into uniformly spaced time intervals defined by the specified time interval (in this case months per the declared variable period (d3.time.month)). This has just created an array across the x axis with all the month values!
Populate the array
In the next section we generate our new array (newData) with the values from the original data array and where necessary (there’s no value) 0 in the value field.
It’s all contained within the following code;
var newData = x.ticks(period)
               .map(function(monthBucket) {
                   return _.find(data,
                       { date: monthBucket }) ||
                       { date: monthBucket, value: 0 };
                });
x.ticks()
The x.ticks(period) portion recalls our new padded array of months.
.map([object])
In a wider (JavaScript) sense the map() method creates a new array by copying all enumerable properties from the object into the new array. This is implemented with .map which is used here;
               .map(function(monthBucket) {
                   return _.find(data,
                       { date: monthBucket }) ||
                       { date: monthBucket, value: 0 };
                });
In the example we are examining, the [object] is provided by the passing the date from the x.ticks(period) function as monthBucket. Whatever is returned by the function will get placed into newData. It’s within this function that we use the Lo-Dash _.find utility.
In common speak _.find will look over over the objects in an array (data) and will return the the first instance that it finds which matches its specified patten (in our case it will match whenever the date element in data equals an array element specified by our x.ticks(period) (monthBucket) values or (if no match is made) it will return the date element from monthBucket and the value of 0.
The end result is an array called newData of objects containing equally spaced date elements across the range that we provided at an interval that we specify with values corresponding to our original array data where it matches the date in our new array and where it doesn’t, we introduce the value 0.