3 Fast Feedback Loops
In the previous chapters, I outlined what drives an organisation and how the path towards a vision can be broken down into strategic initiatives and managed with a flow-based system. In this chapter, we want to check if we are doing things right. Do we see how well we are fulfilling our mission? How can we evaluate the quality of our strategy? Which navigation tools are available to us? What do we need to quickly adapt to changing environments? “Fast feedback loops” is the answer to many of these questions. This kind of loop has become the centrepiece of business agility in the last few years. Generally speaking, there are three different types of loops: meetings, metrics and personal feedback. For a thorough description and discussion of personal feedback, please go to Part III, Chapter 1 (not published yet).
3.1 Meetings
Much, if not all, has already been said about agile meetings. If we round up the usual suspects, we will notice a few characteristic features.
Despite the differences between the individual formats, meetings in a self-organising environment all share the following features:
Conciseness: Everything is about coordinating as quickly and precisely as possible, from the classic 15-minute timeframe for Standups, to diverse ad-hoc agreements or the selection of specific topics.
Regularity: Although self-organising enterprises communicate as needed, regular meeting sequences are helpful. On the one hand, regularity ensures that cross-system coordination takes place and on the other hand, they keep the cost of coordination low. This is as important for portfolio planning as it is for controlling product quality. To ensure product quality, interested employees from all areas at sipgate meet every 14 days for a so-called demo meeting to show one another their current results. This meeting is not a work-in-progress report, rather it’s about demonstrating products that have been delivered to customers and are expected to create value.
Focus: Usefulness is naturally the standard measuring stick. What results are needed to make the meeting worth the participants’ time? Who should take part? Or, for the sake of simplicity, who does not need to attend? Focus also means understanding the differences between operational meetings (Standup), strategy-oriented meetings (Portfolio) and learning formats (Retrospectives). In the end, the right people should meet at the right time in the right context to provide an adequate Return on Time Invested (ROTI). In self-organising environments, there are no overwhelming agendas. Instead, a focal point is set such as testing prototypes, assessing business options, working on quality issues or evaluating data.
Directness: Self-organising enterprises prefer face-to-face communication. Agile Meetings are neither about traditional status reporting or formal presentations, nor serving only individual interests. One-way communication is as undesirable as political games. Rather, it should be a professional exchange about the current results and challenges. The seating order can influence the quality of this exchange as much as the choice of location. Is everyone gathered around a huge conference table? Does each person have their laptop opened up? Is it possible to move around freely? And is the focus really on direct contact, or is it a case of death-by-PowerPoint?
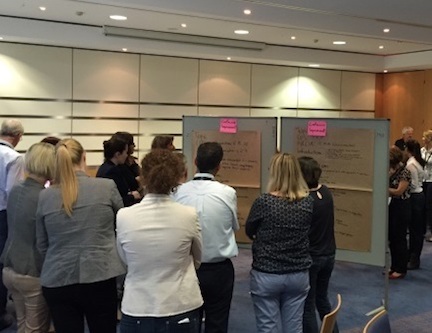
Connecting Mental and Physical Presence: It is no secret that meetings are conducted with more than just our brains. It’s important to engage as many senses as possible. This can happen in many ways: simply standing at the Standups, wandering through gallery-type presentations, using the so-called Law of Two Feet for decision-making or designing workshops for customers who put their hands directly on prototypes. A spectacular example of such activities is the stairwell meeting held by the Richards Group. Information that is relevant for all employees is conveyed as soon as possible in the stairwell that connects the two floors of the company building—thus building a bridge between the different areas, symbolically guarding against compartmental thinking.
Facilitation: In self-organising enterprises, facilitation is rarely done by specialists. According to the idea of encouraging leadership at all levels, facilitation is spontaneously taken over by a meeting participant or determined upfront on a rotating basis. The latter is based on the principle of distributed responsibility, which is especially meaningful at a cross-system level. This principle helps arrange the meetings in a variety of ways and cultivates a broad range of leadership impulses.
Professionalism: Leading effective meetings at the system level is not child’s play. Whether it is coordinating various delegates, seeking stakeholder agreements or designing customer events, many factors for a successful meeting are defined in the preparation phase: setting goals, choosing participants, organising the communication process, as well as documenting and reviewing the results.
3.2 Metrics
The second feedback loop that is used as a standard in self-organising environments is metrics. It’s common knowledge that in traditional organisations much is measured but little is learned. The majority of companies are characterized by figures that sustain the illusion that complex systems can be easily controlled: from company-wide budget planning to department specific cost efficiency and individual performance indicators. This illusion is the reason why many agile practitioners are sceptic of metrics. Most agile practitioners have worked in traditional environments and had bad experiences with metrics. “Why should we measure?”, is how a senior developer at a mid-sized IT service company once made the point: “We know when we deliver good work. Management should trust us instead of wasting our time with pointless indicators.” Although I can understand such concerns, it’s a little like throwing the metrics baby out with the command-and-control bathwater. Because true learning is hard to achieve without measuring what we actually accomplish. How do we determine if we have done a good job? If we have made the best use of our capabilities? Whether we actually improve if we change our way of working? And if the product we ultimately deliver to the customer has the expected value? Which leads us to the big question of what we want to measure and how we do this. Dan Vacanti recommends a lean set of metrics for this purpose.[1] In his view, three metrics are enough to inspect and adapt the quality of our workflow:
- Work in Progress is the number of parallel work items that are being worked on at the same time in any particular activity of our value stream.
- Cycle Time is the time each work item needs to flow through our system to reach the customer.
- Throughput is the amount of work we complete in a given amount of time.
In Actionable Agile Metrics for Predictability Vacanti shows us how we can use a single tool to collect all three measurements: The Cumulative Flow Diagram (CFD). What exactly is a CFD? Basically, a CFD gives us information about the amount of work in our workflow. It shows us how much we have in the Option Pool, how much we are working on and how much is completed over time. Beyond that, we can capture how much work is in which stage of activity, such as idea generation, development or validation. Regardless which degree of detail we are interested in, a CFD is always produced in the same way: a timestamp is assigned to every work item (ticket) as soon as it enters the next activity of our value stream.
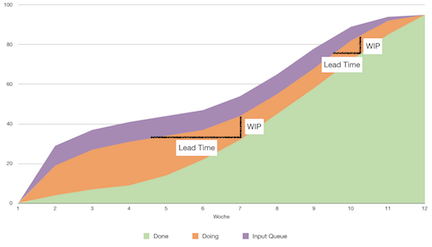
Figure 3-2 shows a sample CFD, which allows us to see several things at one glance:
- The proportion between pending work (see Input), work that we are currently working on (see Doing) and completed work (Done).
- The respective WIP limit, meaning the number of all work items that are found in our work system at a given time (vertical line between input and done).
- The average cycle time of work from the chosen starting point in our workflow (the initial point at the very left of the horizontal line within the Doing band) up to the time of completion (the very right of the same horizontal line).
- The average throughput, which is ascertained from the slope of the lower line of the Doing band.
A CFD gives us insight about the quality of our workflow as well as how it develops over time. For example, we can follow the relationship between started and completed work by simply checking if the lines between Input-Doing and Doing-Done have a similar slope, or if the lower line flattens out. If the latter is the case, we know we are finishing less work than we are starting — resulting in a bottleneck, which can eventually lead to a complete standstill.
There are, of course, other metrics for assessing our agile fitness. For example, Histograms are a type of bar chart showing clusters of average cycle times. Another example is a scatter plot, which gives a spatial illustration of the real cycle time per work item. Or even flow efficiency, which shows the relationship between the average cycle time and the actual amount of time that was actively spent working on specific work items. Together with the CFD, such metrics help us to establish Service Level Agreements that we can — assuming a stable, WIP-limited work system — adhere to with a high degree of probability. When we implement a smart control system, we basically know how long, on average, we spent a specific piece of work. Our commitments are no longer based on rough estimates, but on objective performance markers. This way, we can make agreements with our customers and fulfil the expectations associated with those agreements, without overloading our system. Other tools that can strengthen our predictability and reliability are classes of service, which groups work according to risk and prevents unnecessary cost of delay, as well as forecasts that enable future prognosis based on historical data.[3]
3.3 Control
Why are feedback loops so important for agility? The way I see it, there are four obvious answers:
- Business agility depends on lean management principles. The more unfinished, delayed or accrued work gets dragged along, the more difficult it becomes to deal with it. CFDs, as well as scatter plots, give us exact information on this situation.
- The awareness of employees rises and falls with the amount of work they are busy with. If it´s too much, people will not find the time to look beyond their own area – let alone discover new options. Only through voluntary constraints are employees able to sufficiently concentrate and, at the same time, gain the necessary space to observe and communicate. Such mindful monitoring is only possible with strict WIP limits and the team’s commitment to focus on business-critical bottlenecks and blockades.
- The response time of a company does not only need awareness, but also time to discuss what people are aware of and what this means for the business. If self-organising enterprises want to use all employees as sensors for what is going on in the market, they need effective meetings to coordinate accurate responses to what they sense. The earlier such coordination occurs, the easier it is to keep up with the market dynamics.
- The changeability of an enterprise increases with the quality of organisational learning and vice versa. Visualising flow is helpful for this, as is recognizing and dealing with critical points in our workflow. It needs a smart system of meetings where all people are given an opportunity to share their own perspectives. And it needs metrics showing current performance levels to help us accurately discern the strengths and weaknesses of our system.
However, feedback is not only important for managing the daily business. As much as it helps to keep our standard products and services in order, it is also important in a completely different area: innovation. It’s nothing new that this area is associated with a large amount of uncertainty. The key question is how we deal with this uncertainty. Whatever metrics you prefer, the main point is to prevent hierarchical methods of control. In this respect, there are a few self-critical questions which cannot be avoided:
- Does the metric help us understand the current performance of our system? Does it show us where we need to improve?
- Is this metric relevant to our mission? Does it say something about the value we generate for our customers?
- Are all metrics integrated into our work? Are they in the hands of those people that should benefit from them? Are they used for self-control and not for surveillance by management?
- Are we using a cohesive control system versus just individual metrics? Do the measurements help us identify problems in the overall value stream? Do we know if we have found solutions for these problems?
If you can answer, in good conscience, yes to questions 1 through 4, then is very likely that you already use metrics according to self-organisation ideals. If not, you probably have already identified potential areas of improvement in your work system. Either way, you find yourself in another feedback loop—namely the one resulting from recursive meetings and metrics. It’s the nature of metrics to call for meetings. How else can we interpret them and determine the next steps? To avoid overdoing it with meetings, I recommend to regularly review your current answers to the above questions:
- Who is interested in this feedback? For example, who should receive customer feedback?
- Who needs this feedback for making decisions? Who should consult with whom about it?
- How should this consultation be done?
- Who also needs to be informed about it? How will this be done?
- Which decisions need to be made?
- Who is responsible for implementing the decisions based on the feedback received? The questions might seem simplistic. However, the next chapter will make it clear that the answers to these questions contain certain hazards.
Key takeaways from this chapter
This chapter shows how you can gain clarity, quality and certainty with fast feedback loops. Such prospects are promising in times like these. As such, it pays off to invest some time and effort to implement feedback in a way that will meet your needs. In self-organising enterprises, three loops have proven themselves especially useful: meetings, metrics and personal feedback. Since personal feedback is discussed in detail in the second part of this book, this chapter concentrates on the first two loops. You get an overview of the most common meeting principles, formats and techniques, and learn how you can use a single metric, the Cumulative Flow Diagram, to determine the quality of your process. It is essential that meetings and metrics are not dictated from above. In order for feedback loops to be a learning tool, they must make sense for everyone involved. Otherwise, instead of contributing value, they will only create waste.