WMI exporter
The node_exporter is ideal for gathering metrics on *NIX based systems, but Windows based systems will require a different exporter. The is where the WMI exporter comes in.
It has a wide range of collectors available and by default it will enable;
- CPU usage
- “Computer System” metrics (system properties, num cpus/total memory)
- Logical disks, disk I/O
- Network interface I/O
- OS metrics (memory, processes, users)
- Service state metrics
- System calls
- Read prometheus metrics from a text file
For this example we will make the assumption that the Windows computer has a IP address assigned. In the case for the example below the IP address we will be setting up and connecting to will be ‘10.1.1.99’.
Installing the WMI exporter
From the wmi_exporter releases page, download the appropriate installer for your system.
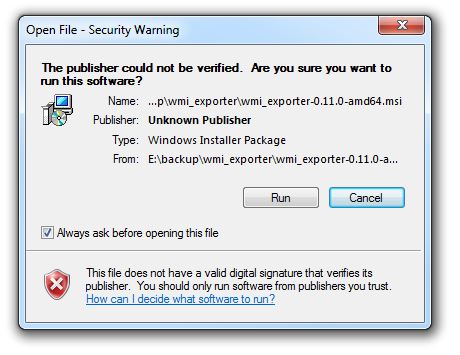
Run the file (the sequence below illustrates using the amd64 msi and version v0.11.0)
We will be asked for verification;
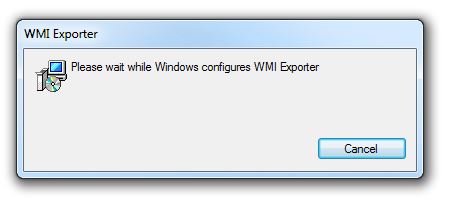
And then the program is configured;
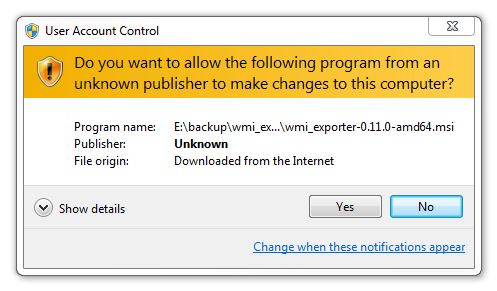
We also need to let the program make changes to the computer;
We should now have the WMI exporter service running as a service on our Windows computer.
We can test this (on the Windows machine) by entering the local address (http://localhost:9182/metrics) into a web browser (The default port for wmi_exporter is 9182). This should produce a nice long list of metrics something like the following;
# HELP go_gc_duration_seconds A summary of the GC invocation durations.# TYPE go_gc_duration_seconds summarygo_gc_duration_seconds{quantile="0"} 0go_gc_duration_seconds{quantile="0.25"} 0go_gc_duration_seconds{quantile="0.5"} 0go_gc_duration_seconds{quantile="0.75"} 0.001go_gc_duration_seconds{quantile="1"} 0.001go_gc_duration_seconds_sum 0.002go_gc_duration_seconds_count 8# HELP go_goroutines Number of goroutines that currently exist.# TYPE go_goroutines gaugego_goroutines 13# HELP go_info Information about the Go environment.# TYPE go_info gaugego_info{version="go1.13.3"} 1Adding adding our Windows exporter to Prometheus
Just as we did with the node_exporter we need to add the IP address of our new metrics source (10.1.1.99) to the Prometheus prometheus.yml file. To do this we can simply add the IP address of our computer that is running the wmi_exporter as a new target with the default port (9182) and we are good to go.
On our Prometheus server;
At the end of the file add the IP address of our new node - targets: ['10.1.1.99:9182'];
Then we restart Prometheus to load our new configuration;
Now if we return to our Prometheus GUI (http://10.1.1.110:9090/targets) to check which targets we are scraping we can see three targets, including our new node at ‘10.1.1.99:9182’.

Let’s see our new node in Grafana!
Go back to our Grafana GUI at http://10.1.1.110:3000.
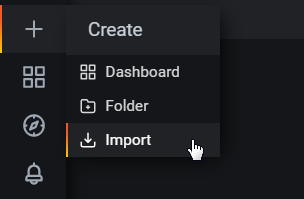
Select the create icon which is the plus (‘+’) sign on the left hand side of the screen and then select ‘Import’.
Here we will follow the same process to import a pre-prepared desktop for Windows host metrics. In the Grafana.com Dashboard box enter the dashboard number 10171.
After going through the process our new dashboard should now be there in all its glory
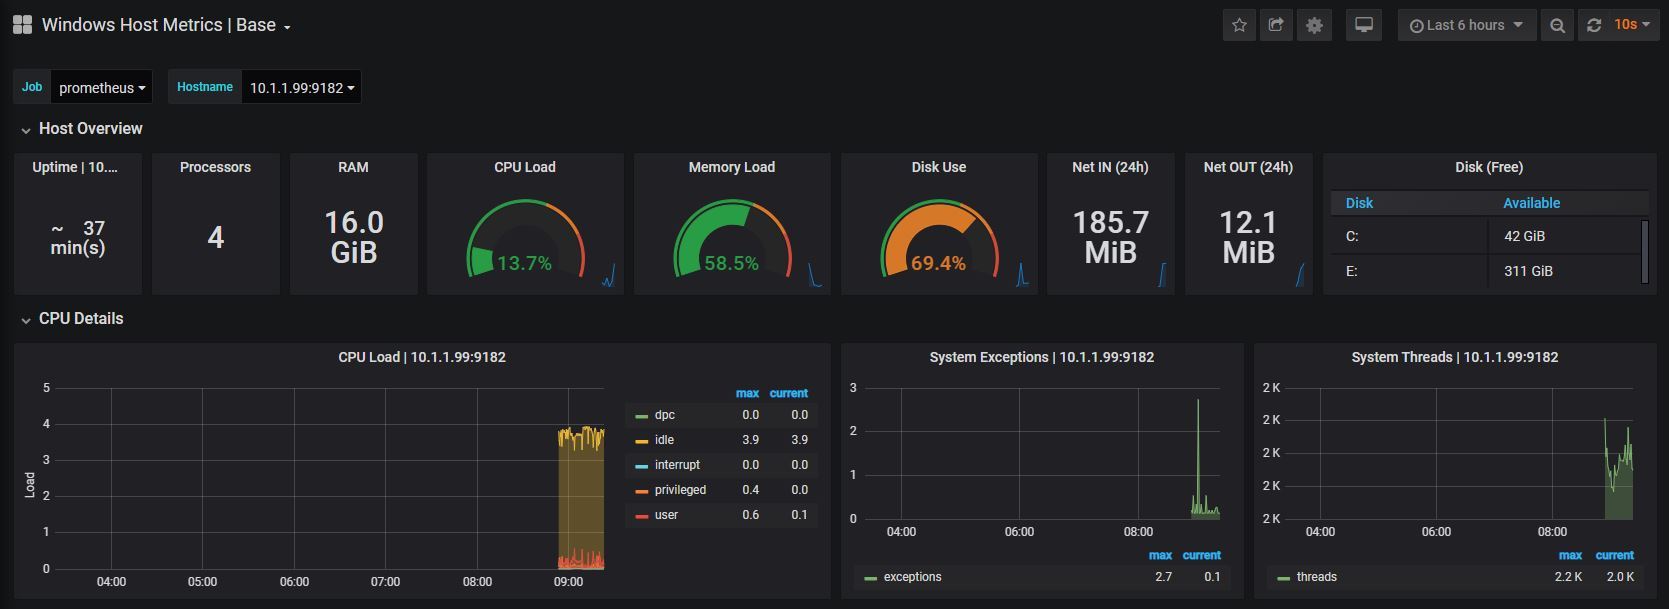
At an early stage there probably won’t be much to see, but take a few minutes to explore the additional panels at the bottom of the screen. This is a manifestation of the huge number of metrics that we saw in text form when we tested the scraping of the wmi_exporter installation.