Adding a monitoring node to Prometheus
In keeping with the information on the prometheus.yml file, we can simply add the IP address of a node that is running the node_exporter as a new target and we are good to go.
Let’s add the node that we configured in the previous section at 10.1.1.109.
At the end of the file add the IP address of our new node - targets: ['10.1.1.109:9100'];
Then we restart Prometheus to load our new configuration;
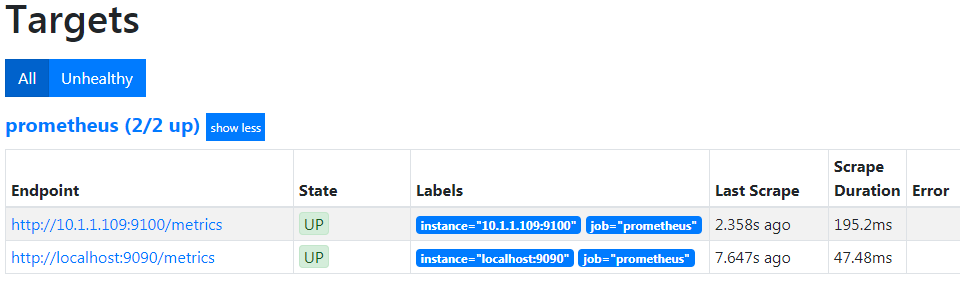
Now if we return to our Prometheus GUI (http://10.1.1.110:9090/targets) to check which targets we are scraping we can see two targets, including our new node at 10.1.1.109.
Let’s see our new node in Grafana!
Because we have already added Prometheus as a data source in Grafana, seeing or new node in a dashboard is ridiculously simple.
Go back to our Grafana GUI at http://10.1.1.110:3000.
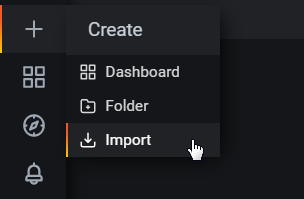
Select the create icon which is the plus (‘+’) sign on the left hand side of the screen and then select ‘Import’.
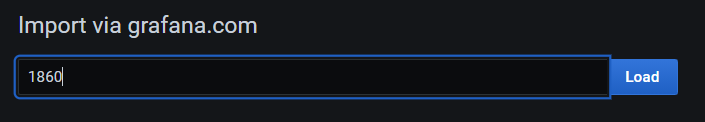
In the Grafana.com Dashboard box enter the dashboard number 1860 and then click on then ‘Load’ button.
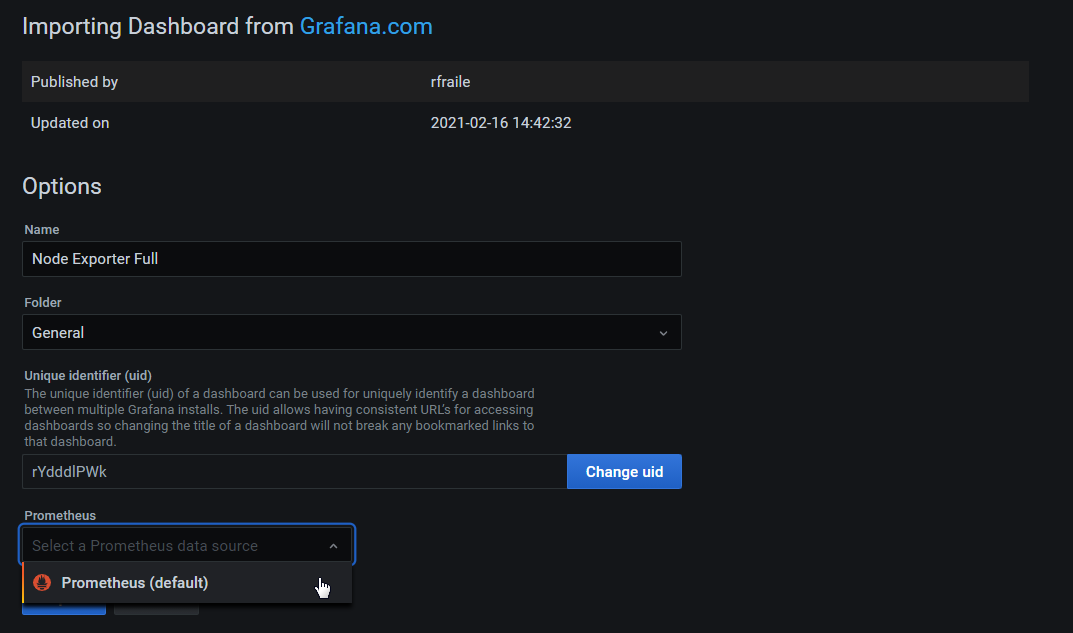
Under the prometheus Option use the drop-down arrow and select ‘Prometheus’.
Then click on ‘Import’.
The dashboard should now be there in all its glory
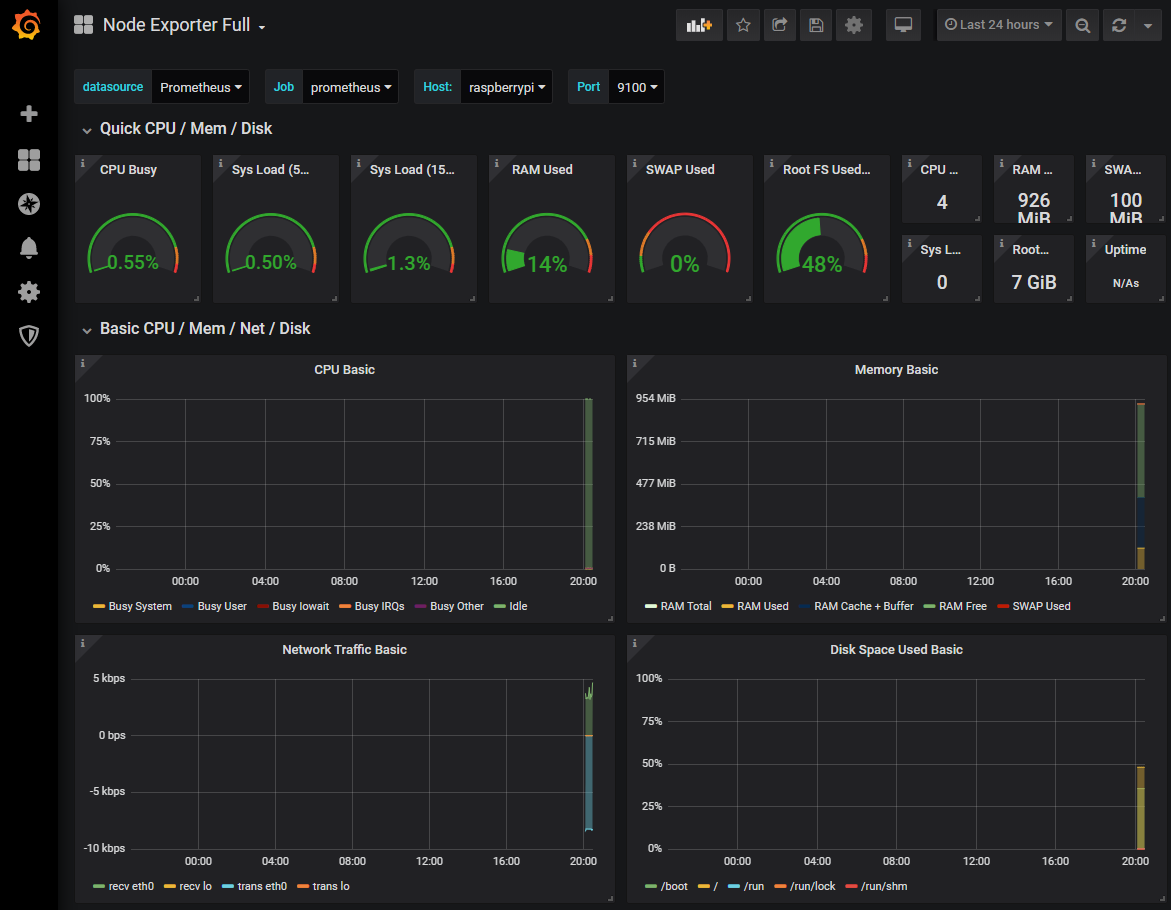
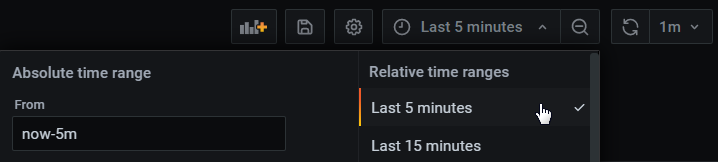
At this stage there probably won’t be much to see, but we can shorten the displayed time to the past 5 minutes by using the custom time range menu at the top right of the screen.
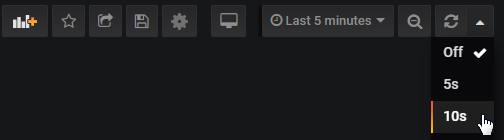
To keep the screen updating select the auto-refresh setting from the top right hand corner. In the screenshot below we are selecting 10 seconds.
The end result is an automatically updating indication of the performance of our Raspberry Pi at 10.1.1.109.
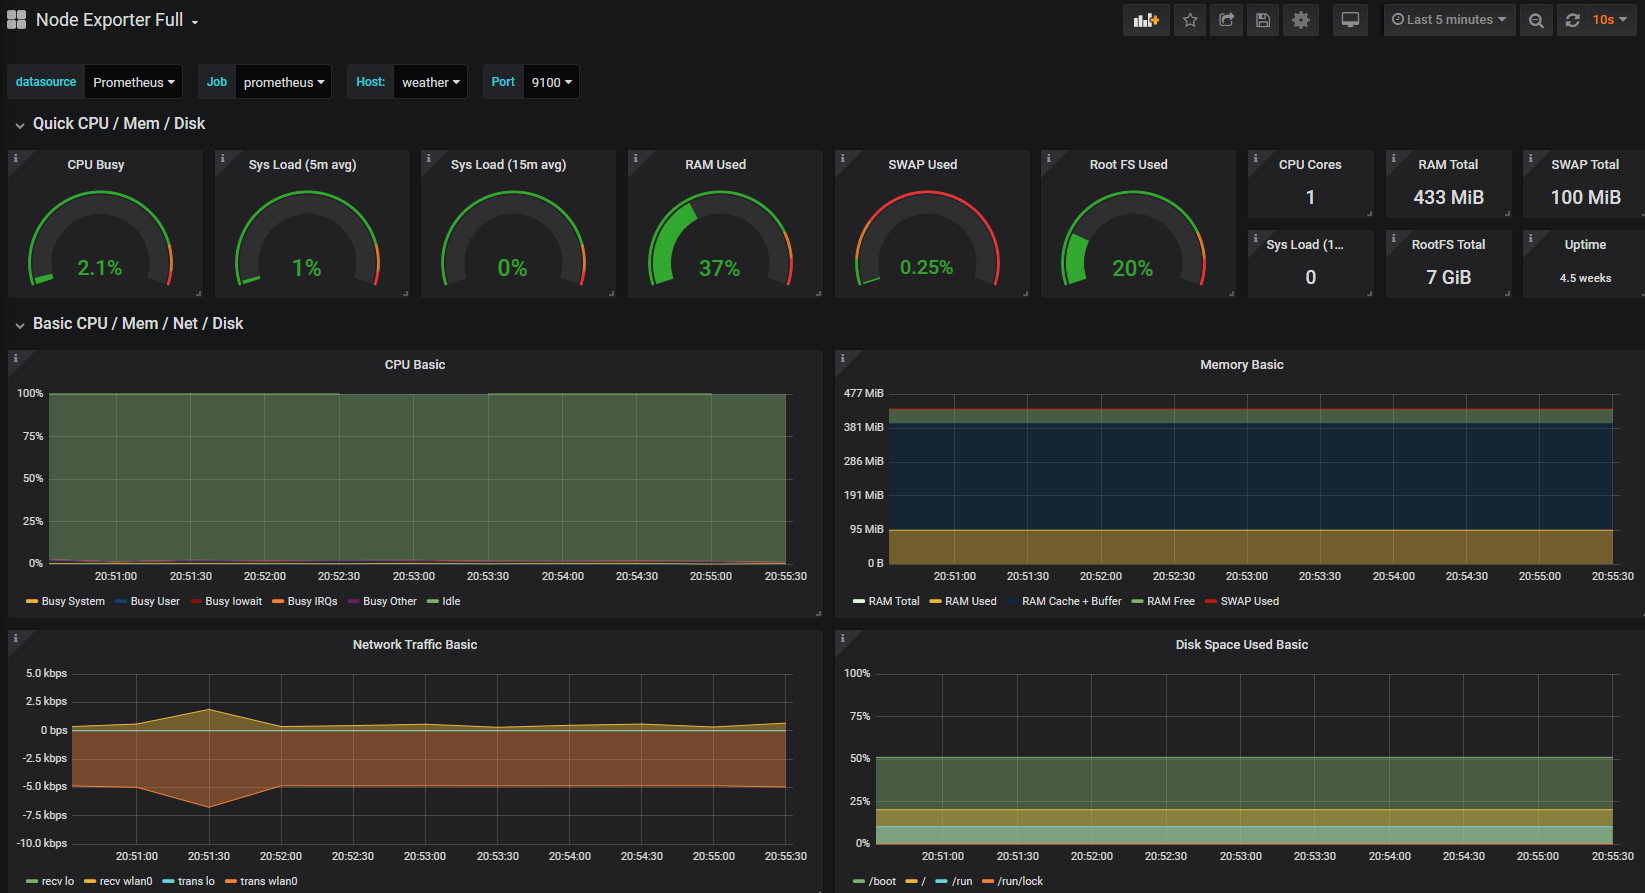
Take a few minutes to explore the additional panels at the bottom of the screen. This is a manifestation of the huge number of metrics that we saw in text form when we tested the scraping of the node_exporter installation, brought to life in graphical form.