Prometheus and Grafana Tips and Tricks
Fill in Null Values in a Graph
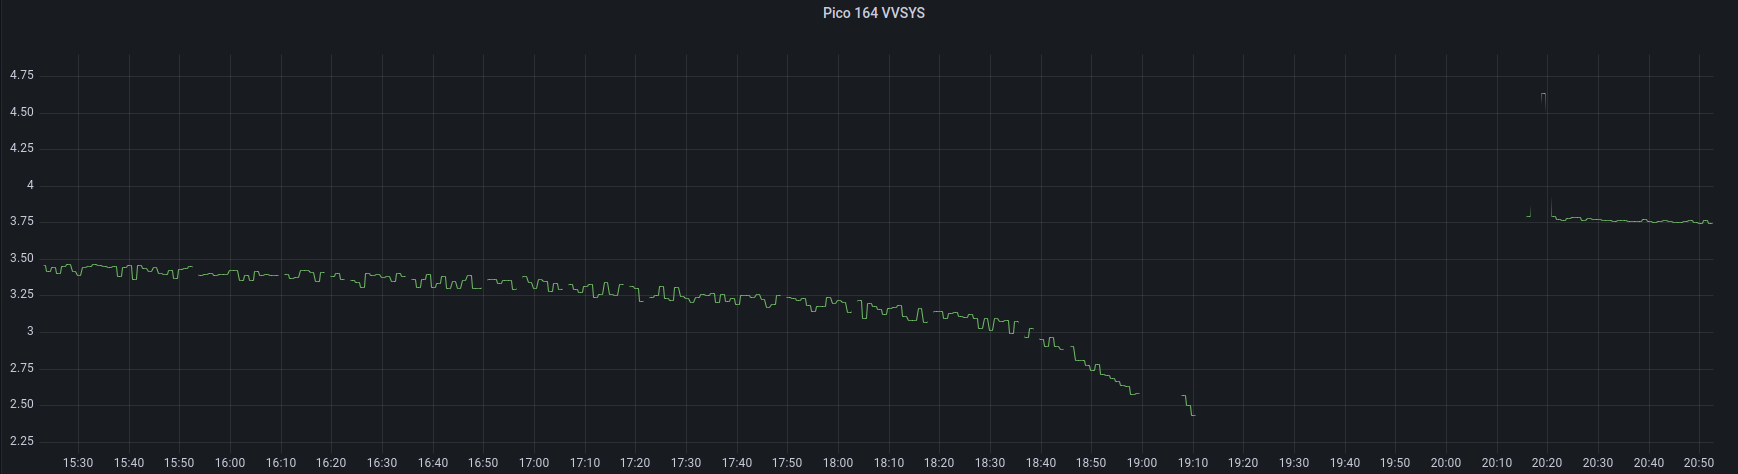
It is unlikely that any monitoring system is perfect and as a result we can expect to occasionally see gaps in our data that will translate into gaps in our graphs.
While ideally the answer to this problem is to improve our data gathering process, this isn’t always going to be possible. The good news is that Grafana has our back.
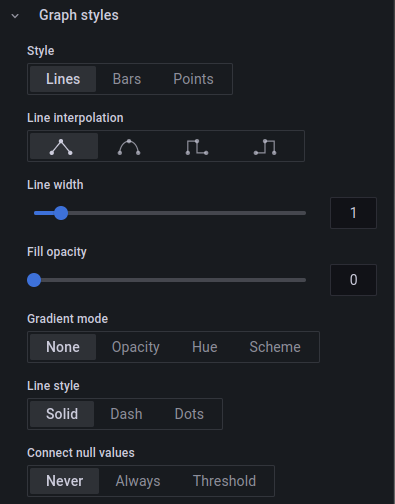
If we go to the ‘Edit’ function for a panel (found in the drop-down that opens up by clicking on the panel name) and scroll down the list of options we come to the ‘Connect null values’ setting under the ‘Graph styles’ heading.
Here we have three options. The first, ‘Never’ means that if we get any null values (no data has been recorded) then we will see gaps in the corresponding places in the graph (like the one above).
If we select ‘Always’ Grafana will automatically connect any two adjacent data points so that the graph looks a little more normal.
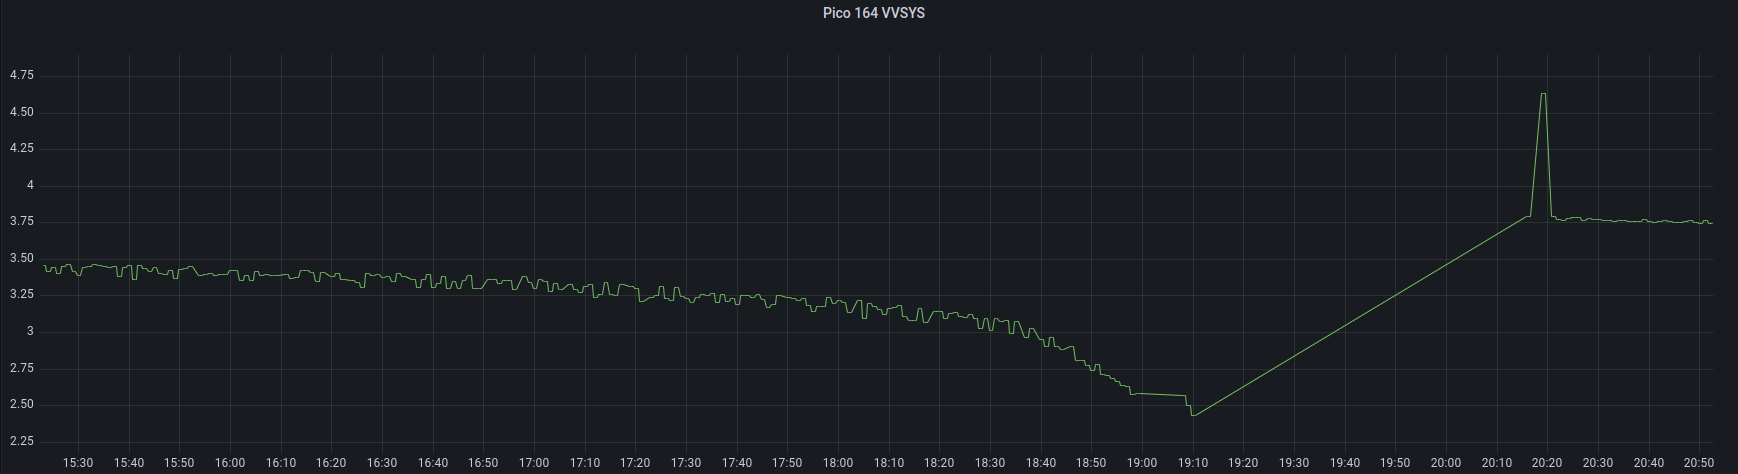
Of course, that might not be what we are wanting as the graph above shows two fairly separate battery discharge curves and in between time, there was no voltage from the battery and therefore no data collected. So if we were being picky we would like to see our small gaps filled in, but the larger ones left in place.
Grafana <hold my beer>.
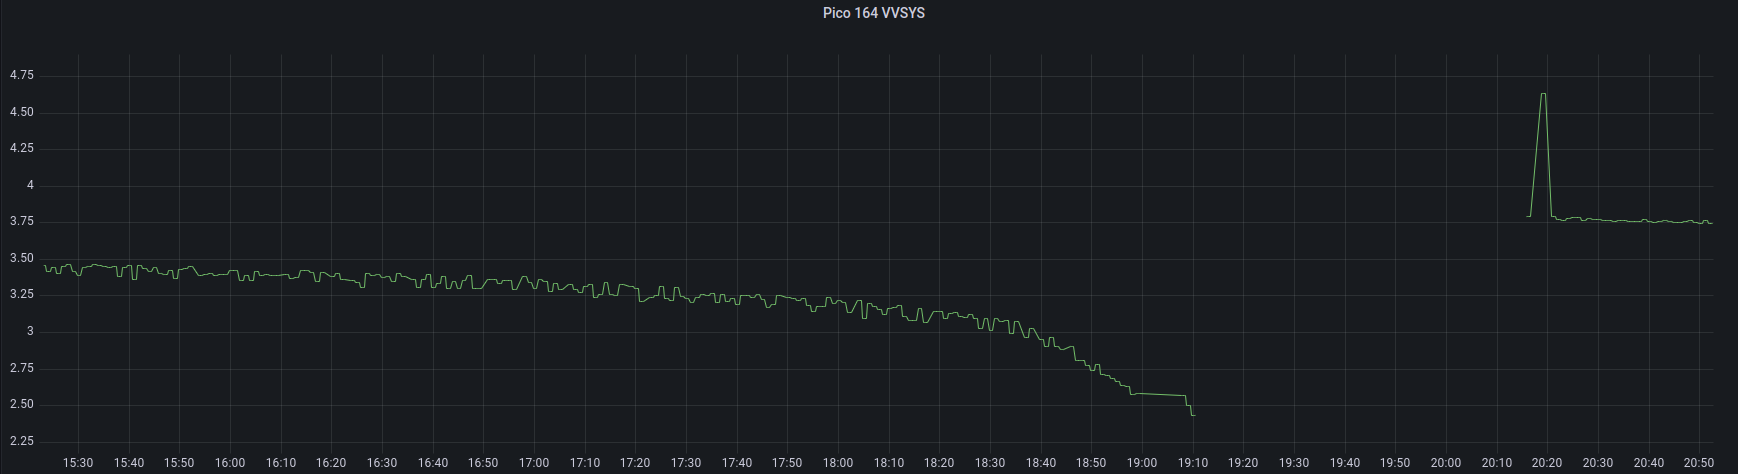
So the following graph is the result of selecting ‘Threshold’ for ‘Connect null values’. In this setting adjacent data points will be connected if they fall under the threshold set. If there are no values (nulls) for the length of time in the threshold, then there will be a gap in the graph like below.
Well played Grafana. Well played.
Exporting Data from a Grafana Graph
While using Grafana is a wonderful experience and it’s hard to imagine improving on the options and nuance that we can gather from a Grafana panel, occasionally we will find ourselves in a situation where we want to export some of the data that we can see in a graph.
Nothing could be simpler.
Just click on the name of the graph panel which will open up a drop-down menu. Select ‘Inspect’ and then ‘Data’.
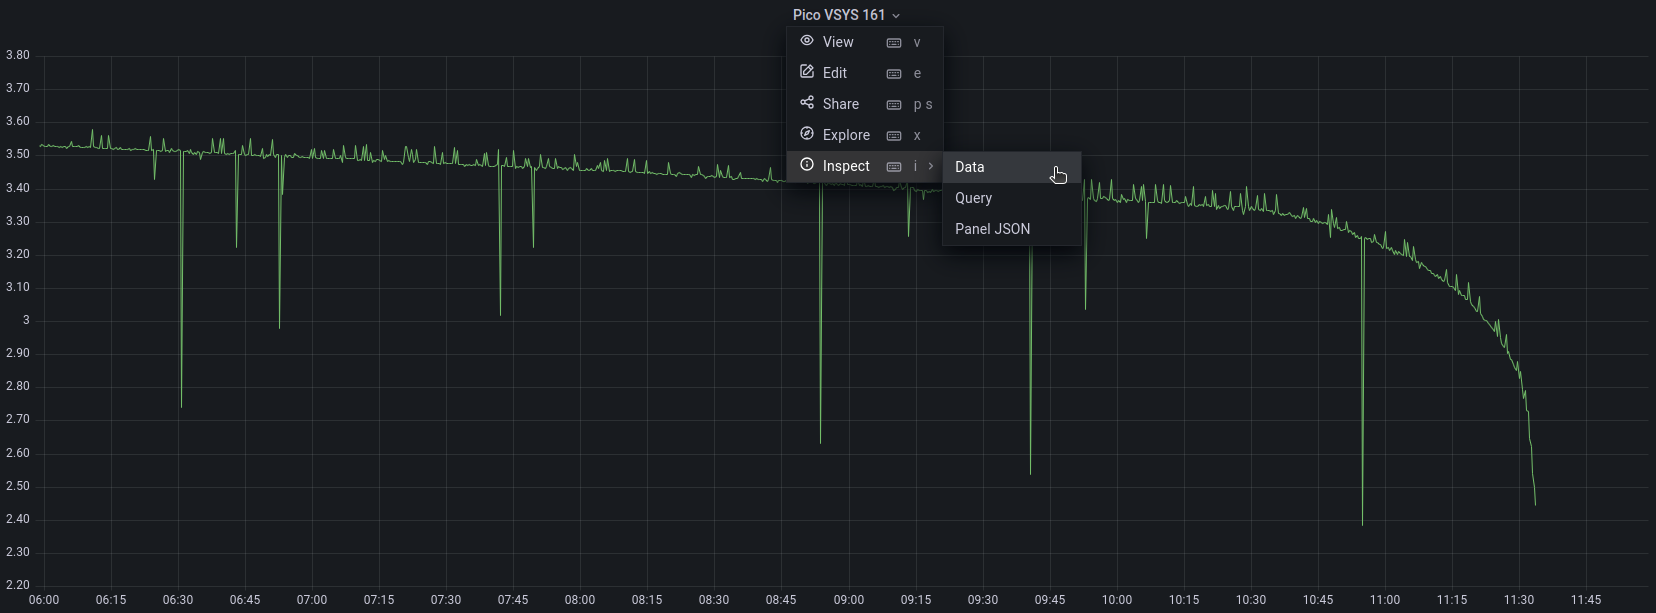
This will then show a page where we can check out the data at our own leisure and it even provides an option for downloading the data as a CSV file.
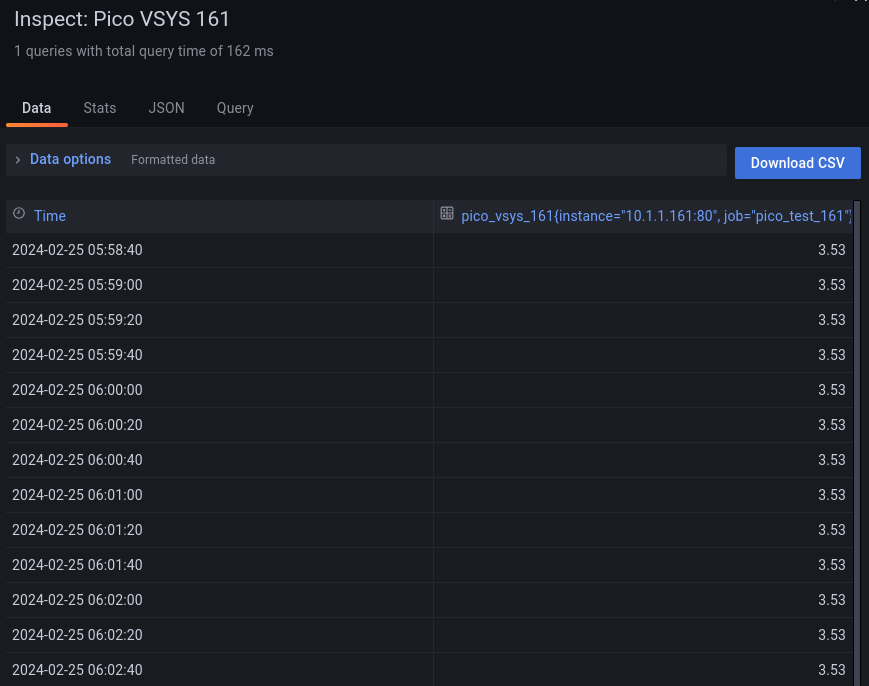
Nice!