Installation
While the Raspberry Pi comes with a range of software already installed on the Raspberry Pi OS distribution (even the Lite version) we will need to download and install Prometheus and Grafana separately
If you’re sneakily starting reading from this point, make sure that you update and upgrade the Raspberry Pi OS before continuing.
Installing Prometheus
The first thing that we will want to do before installing Prometheus is to determine what the latest version is. To do this browse to the download page here - https://prometheus.io/download/. There are a number of different software packages available, but it’s important before looking at any of them that we select the correct architecture for our Raspberry Pi. As the Pi 4 (which I’m using for this install) uses a CPU based on the Arm v7 architecture, use the drop-down box to show armv7 options.
Note the name or copy the URL for the file that is presented. On the 7th of January 2024, the version that was available was 2.48.1. The full URL was something like;
https://github.com/prometheus/prometheus/releases/download/v2.48.1/prometheus-2.4\
8.1.linux-armv7.tar.gz
We can see that ‘armv7’ is even in the name. That’s a great way to confirm that we’re on the right track.
On our Pi we will start the process in the pi users home directory (/home/pi/). We will initiate the download process with the wget command as follows (the command below will break across lines, don’t just copy - paste it);
The file that is downloaded is compressed so once the download is finished we will want to expand our file. For this we use the tar command;
Let’s do some housekeeping and remove the original compressed file with the rm (remove) command;
We now have a directory called prometheus-2.48.1.linux-armv7. While that’s nice and descriptive, for the purposes of simplicity it will be easier to deal with a directory with a simpler name. We will therefore use the mv (move) command to rename the directory to just ‘prometheus’ thusly;
Believe it or not, that is as hard as the installation gets. Everything from here is configuration in one form or another. However, the first part of that involves making sure that Prometheus starts up simply at boot. We will do this by setting it up as a service so that it can be easily managed and started.
The first step in this process is to create a service file which we will call prometheus.service. We will have this in the /etc/systemd/system/ directory.
Paste the following text into the file and save and exit.
The service file can contain a wide range of configuration information and in our case there are only a few details. The most interesting being the ‘ExecStart’ details which describe where to find the prometheus executable and what options it should use when starting. In particular we should note the location of the prometheus.yml file which we will use in the future when adding things to monitor to Prometheus.
Before starting our new service we will need to reload the systemd manager configuration. This essentially takes changed configurations from our file system and makes them ready to be used. We have added a service, so systemd needs to know about it before it can start it.
Now we can start the Prometheus service. .
You shouldn’t see any indication at the terminal that things have gone well, so it’s a good idea to check Prometheus’s status as follows;
We should see a report back that indicates (amongst other things) that Prometheus is active and running.
Now we will enable it to start on boot.
To check that this is all working well we can use a browser to verify that Prometheus is serving metrics about itself by navigating to its own metrics endpoint at http://10.1.1.110:9090/metrics (or at least at the IP address of your installation).
A long list of information should be presented in the browser that will look a little like the following;
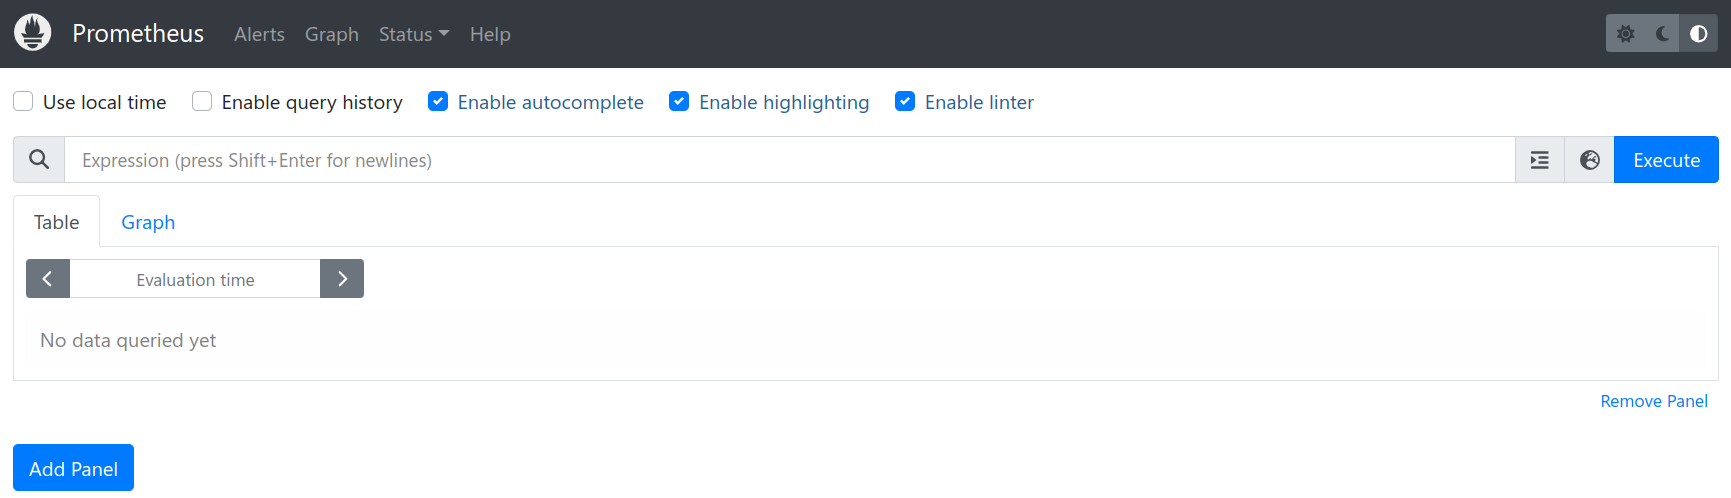
We can now go to a browser and enter the IP address of our installation with the port :9090 to confirm that Prometheus is operating. In our case that’s http://10.1.1.110:9090.
If we now go to the ‘Status’ drop down menu and select ‘Targets’ we can see the list of targets that Prometheus is currently scraping metrics from.
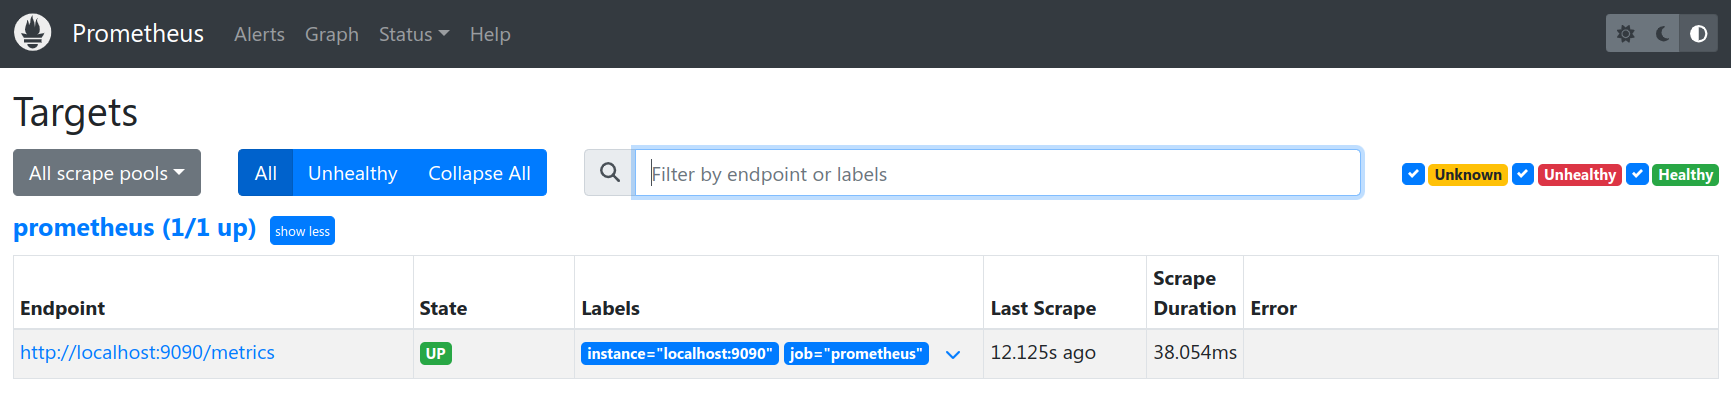
From the information above, we can see that it is already including itself as a metric monitoring point!
There’s still plenty more to do on configuring Prometheus (specifically setting up exporters), but for the mean time we will leave the process here and set up Grafana.
Installing Grafana
There are two different ways that we can go about installing Grafana. Manually, in a way very much like the one that we used for Prometheus, or via the package management service ‘apt-get’. Both methods will be described below, but I will recommend the ‘apt-get’ method as it is simpler and allows for easier updating.
Installing Grafana Manually
In much the same way that we installed Prometheus, the first thing we need to do is to find the right version of Grafana to download. To do this browse to the download page here - https://grafana.com/grafana/download?platform=arm. There are a number of different ways to install Grafana. We are going to opt for the simple method of installing a standalone binary in much the same way that we installed Prometheus.
The download page noted above goes straight to the ARM download page. We will be looking for the ‘Standalone Linux Binaries’ for ARMv7. Note the name or copy the URL for the file that is presented. On the 7th of January 20224, the version that was available was 10.2.3. The full URL was something like https://dl.grafana.com/oss/release/grafana-enterprise-10.2.3.linux-armv7.tar.gz;
On our Pi we will start the process in the pi users home directory (/home/pi/). We will initiate the download process with the wget command as follows (the command below will break across lines, don’t just copy - paste it);
The file that is downloaded is compressed so once the download is finished we will want to expand our file. For this we use the tar command;
Housekeeping time again. Remove the original compressed file with the rm (remove) command;
We now have a directory called grafana-10.2.3. While that’s nice and descriptive, for the purposes of simplicity it will be easier to deal with a directory with a simpler name. We will therefore use the mv (move) command to rename the directory to just ‘grafana’ thusly;
Again, now we need to make sure that Grafana starts up simply at boot. We will do this by setting it up as a service so that it can be easily managed and started.
The first step in this process is to create a service file which we will call grafana.service. We will have this in the /etc/systemd/system/ directory.
Paste the following text into the file and save and exit.
The service file can contain a wide range of configuration information and in our case there are only a few details. The most interesting being the ‘ExecStart’ details which describe where to find the Grafana executable.
Before starting our new service we will need to reload the systemd manager configuration again.
Now we can start the Grafana service.
You shouldn’t see any indication at the terminal that things have gone well, so it’s a good idea to check Grafana’s status as follows;
We should see a report back that indicates (amongst other things) that Grafana is active and running.
Now we will enable it to start on boot.
Installing Grafana Automatically Using ‘apt-get’
So while we call this an automatic method, there is still some manual work to set things up at the start.
First we need to add the APT key used to authenticate the packages:
If we’re using one of the more modern versions of Raspberry Pi OS we may get a warning that apt-key is deprecated. There will come a time in the future when we will need to move to trusted.gpg.d, but that will be a job for our future selves.
Now we need to add the Grafana APT repository (the command below will break across lines, don’t just copy - paste it):
With those pieces of set-up out of the way we can install Grafana;
Grafana is now installed but to make sure that it starts up when the our Pi is restarted, we need to enable and start the Grafana Systemctl service.
First enable the Grafana server;
Then start the Grafana server;
Using Grafana
At this point we have Grafana installed and configured to start on boot. Let’s start exploring!
Using a browser, connect to the Grafana server: http://10.1.1.110:3000.
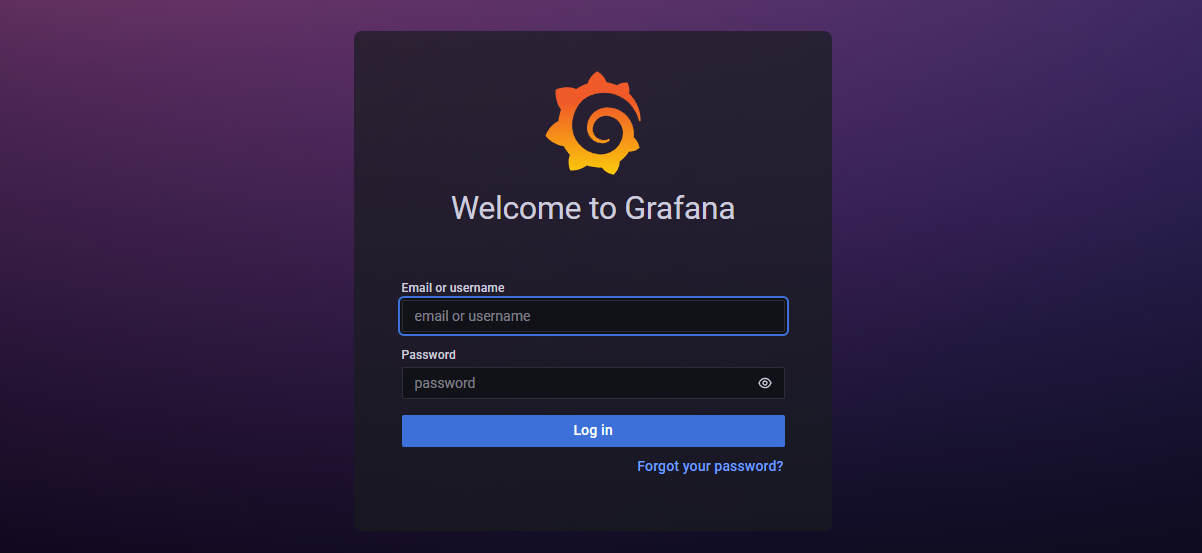
The account and password are: admin/admin. Grafana will ask you to change this password.
The first configuration to be made will be to create a data source that Grafana will use to collect metrics. Of course, this will be our Prometheus instance
From the main page select the panel to add our first data source.
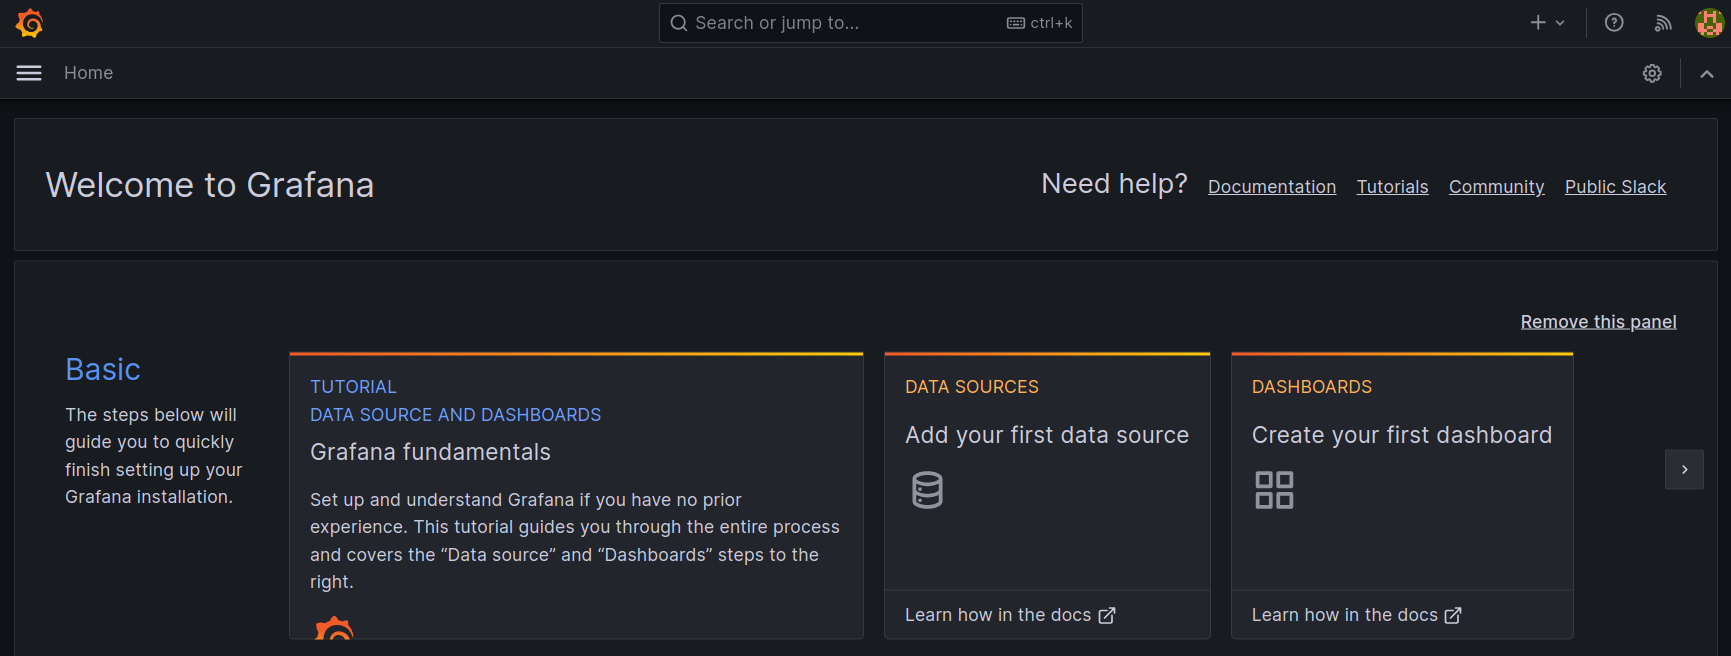
The select ‘Add Data Source’ and then select Prometheus as that data source.
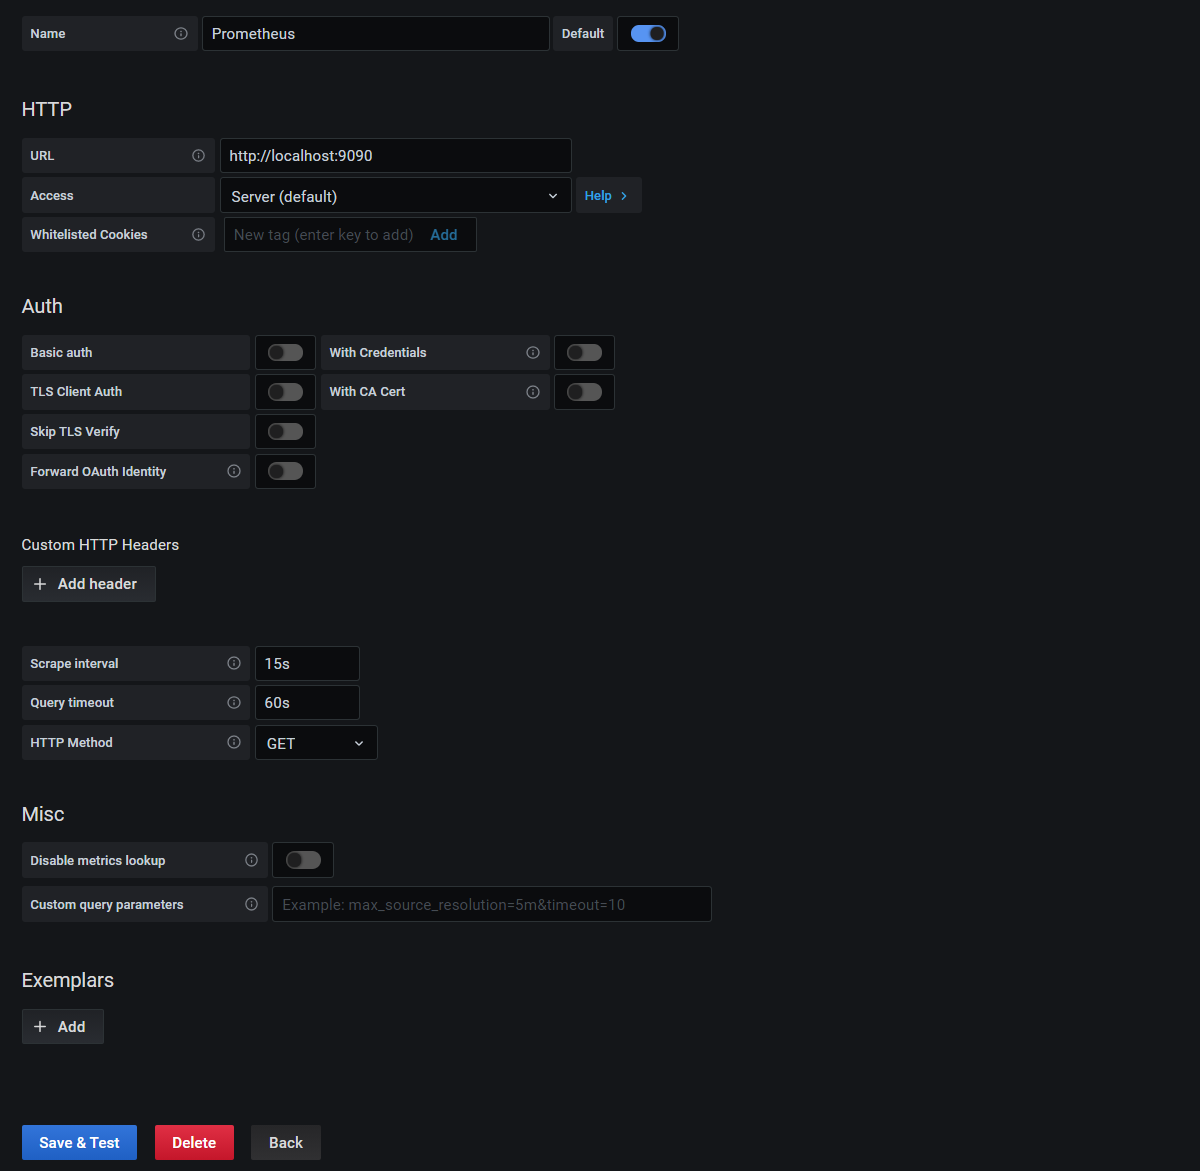
Now we get to configure some of the settings for our connection to Prometheus.
In this case we can set the URL as ‘http://localhost:9090’ (since both Prometheus and Grafana are installed on the same server), leave the scrape interval as ’15s’, the Query timeout as 60s and the http method as ‘GET’. Be aware that on some versions of Grafana, you will need to explicitly type in the URL ‘http://localhost:9090’ or you may receive an error when you test in the next step.
Then click on the ‘Save & Test button’.
We should get a nice tick to indicate that the data source is working.

Great!
Now things start to get just a little bit exciting. Remember the metrics that were being sent out by Prometheus? Those were the metrics that report back on how Prometheus is operating. In other words, it’s the monitoring system being monitored. We are going to use that to show our first dashboard.
Here lies another strength of Grafana. Dashboards can be built and shared by users so that everyone benefits. We will import one such dashboard to show us how Prometheus is operating.
At the top left of our page, click on the icon to return to the home screen.

There is a ‘Dashboards’ panel to create our first dashboard. Let’s click on that to show some available dashboards for our Prometheus instance;
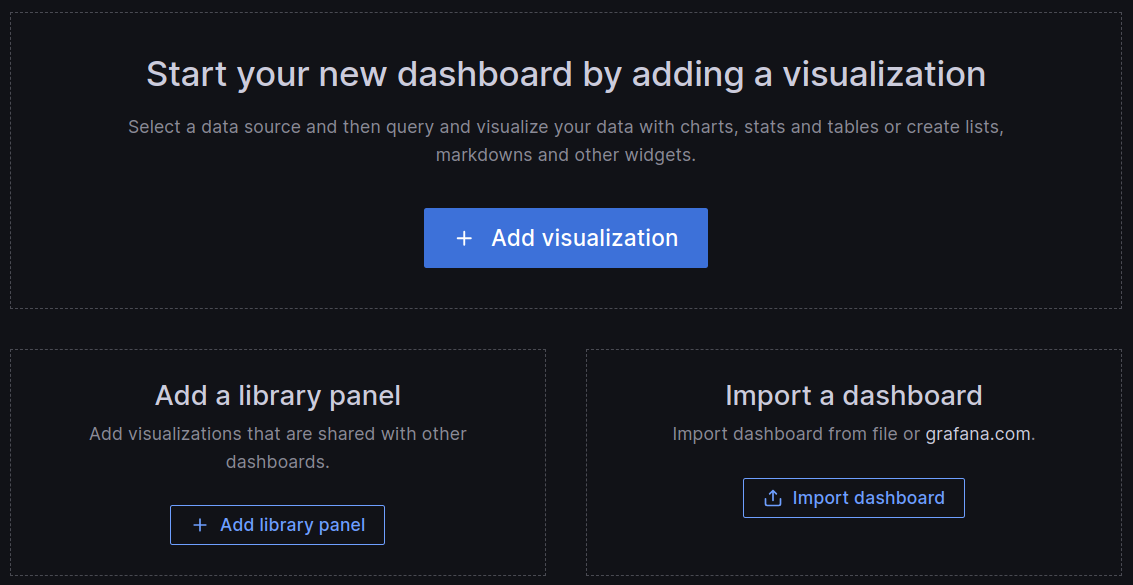
From here we can enter the Grafana dashboard ID number 3662 and click on the ‘Load’ button and then the ‘Import’ button.
And the dashboard will open.
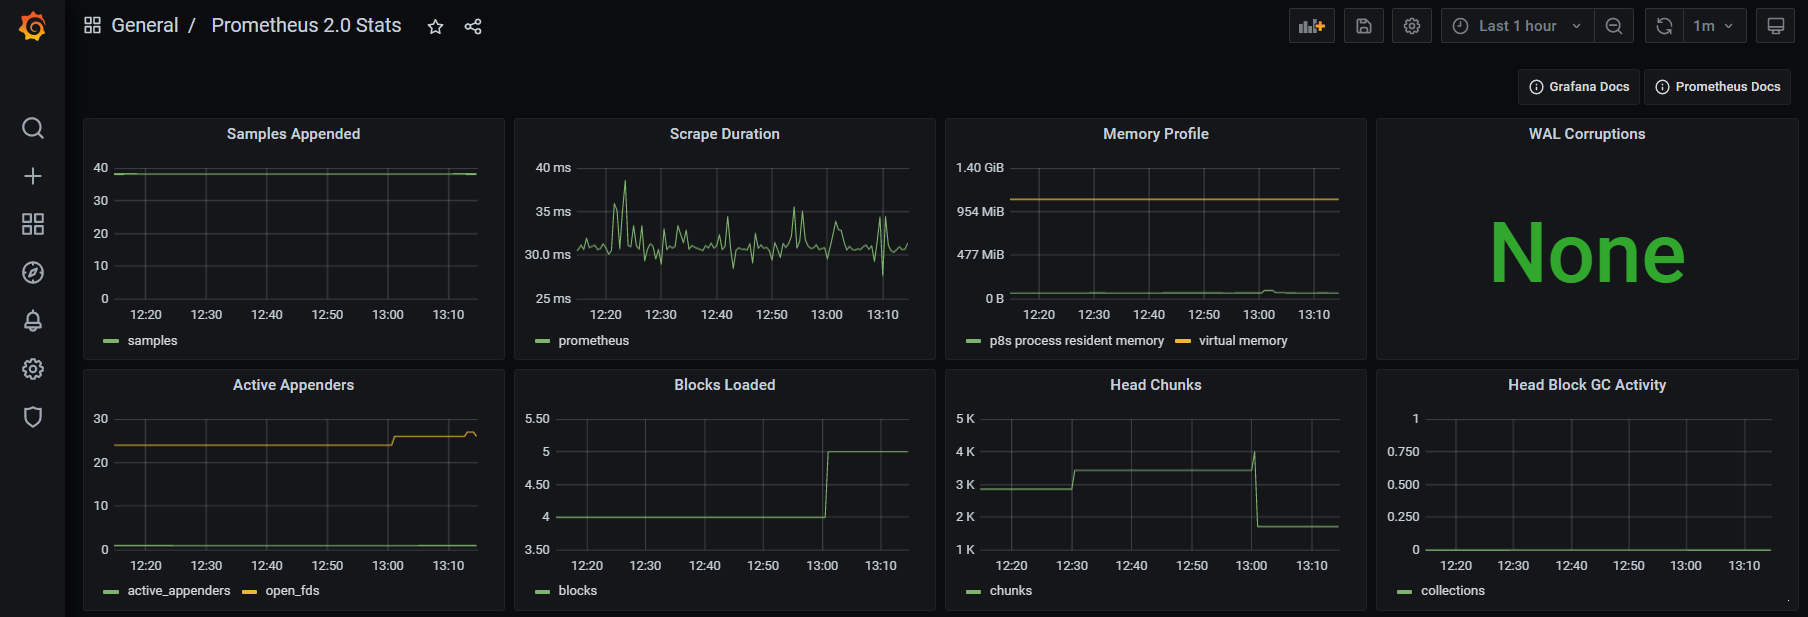
How about that?
We should now be looking at a range of metrics that Grafana is scraping from Prometheus and presenting in a nice fashion.
Trust me, this is just the start of our journey. As simple as the process of getting up and running and looking at a pretty graph is, there are plenty more pleasant surprises to come as we look at the flexibility and power of these two services.