About Grafana
Grafana is an open-source, general purpose dashboard and visualisation tool, which runs as a web application. It supports a range of data inputs such as InfluxDB or Prometheus.
It allows you to visualize and alert on your metrics as well as allowing for the creation of dynamic & reusable dashboards.
Grafana is open source and covered by the Apache 2.0 license and its source code is available on GitHub.
Three of the primary strengths of Grafana are;
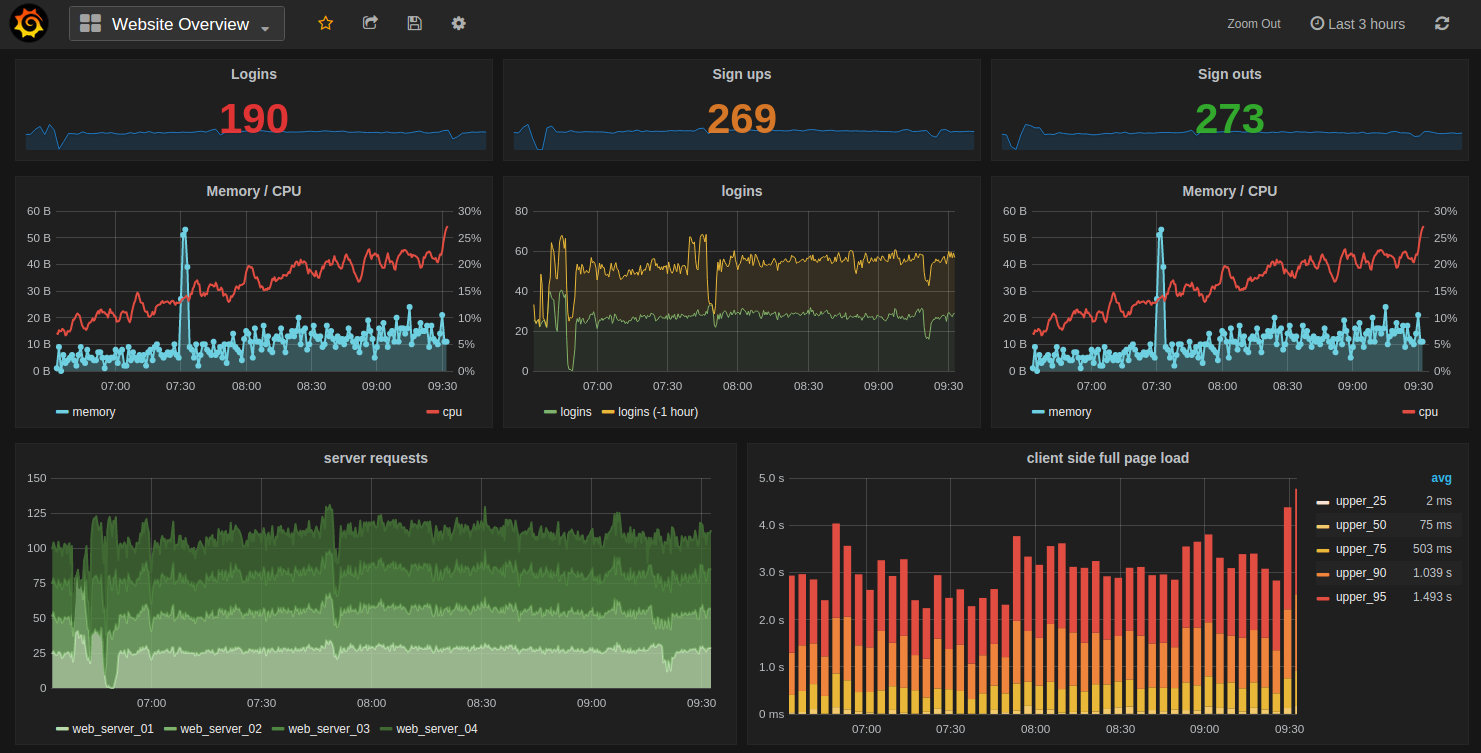
- A powerful engine for the building of dashboards that can contain a wide range of different visualisation techniques.
- The ability to display dynamic data from multiple sources in a way that allows for multi-dimensional integration.
- An alerting engine that provides the ability to attach rules to dashboard panels. These rules provide the facility to trigger alerts and notifications.