IDE
Quickly Create GSP From Controller In IntelliJ IDEA
If we have a action method in our controller and we want to create a corresponding GSP we can press Alt+Enter when the cursor is on the action method. IDEA shows the intention actions and one of them is Create view (GSP page).
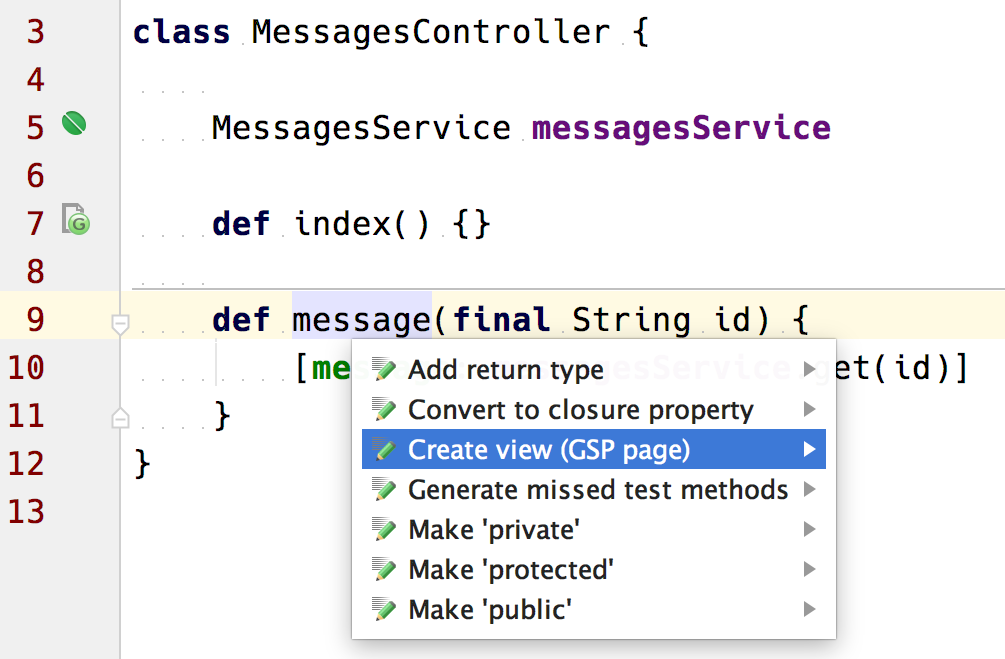
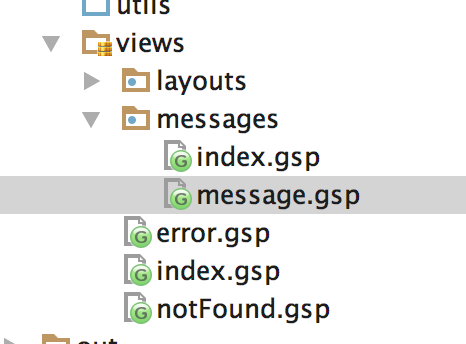
We select this option and IntelliJ IDEA creates a view with the name of our action in the directory grails-app/views/{controllerName}:
Written with Grails 3.0.10 and IntelliJ IDEA 15.
Original blog post written on December 13, 2015.
Go To Related Classes In IntelliJ IDEA
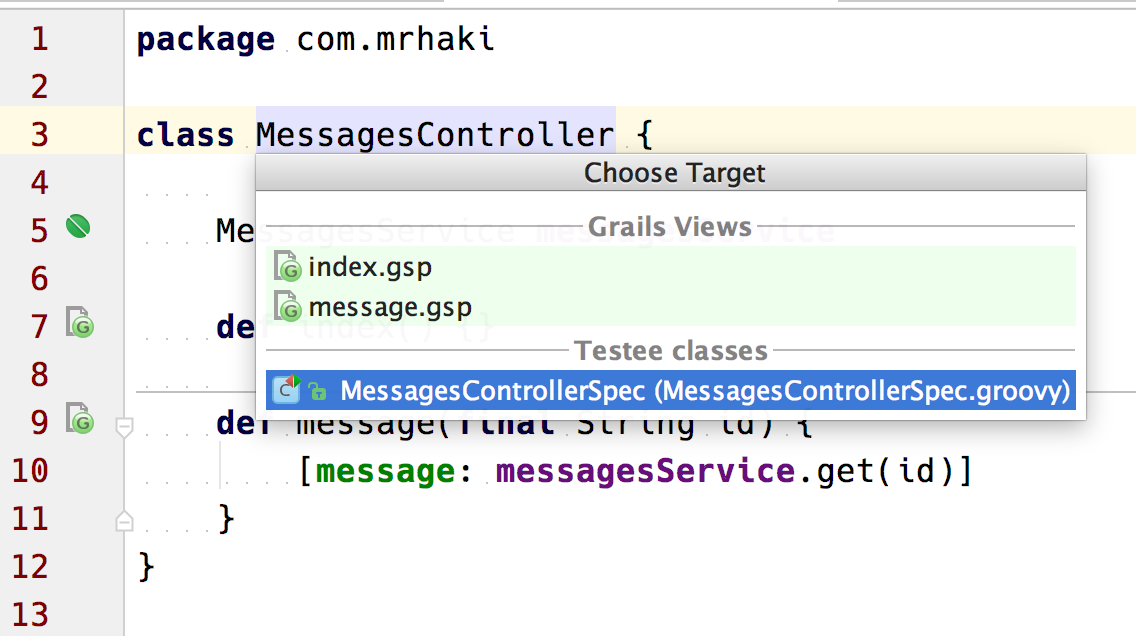
Normally in a Grails application we have classes that are related to each other, but are located in different directories. For example a controller with several views. Or a Grails service with corresponding specifications. In IntelliJ IDEA we can use Choose Target and IDEA will show classes, files and methods that are relevant for the current file we are editing. The keybinding on my Mac OSX is Ctrl+Cmd+Up, but can be different on your computer and operating system. We can also choose the menu option Navigate | Related symbol….
In the following example we are editing the file MessagesController. We select the action Choose Target, IntelliJ IDEA shows a popup menu with the views for this controller and the specification class:
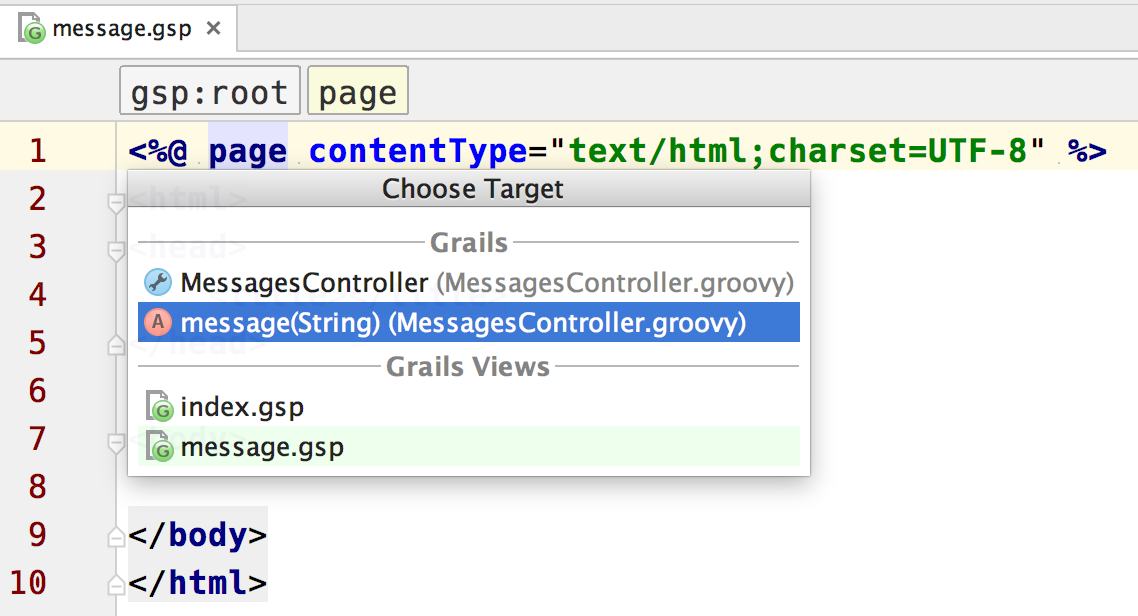
Or if we are editing a view and select the menu option Navigate | Related symbol…. Now we can navigate to the controller, method in the controller and other views:
Written with Grails 3.0.10 and IntelliJ IDEA 15.
Original blog post written on December 13, 2015.
Debugging App in Forked Mode
Since Grails 2.2 by default the run-app command will launch the Grails application in a separate Java Virtual Machine. This is called forked Tomcat execution in Grails. This way the class path of the Grails build system and the application will not intervene and also both processes will have their own memory settings. We can see the settings in grails-app/conf/BuildConfig.groovy where we find the configuration property grails.project.fork.run. When we want to debug our application in an IDE like IntelliJ IDEA we cannot use the Debug command, because this will only allow us to debug the Grails build system. We will not reach breakpoints in our source code. But Grails 2.3 introduces an extra argument for the run-app command: --debug-fork. If we use this extra argument the JVM running the Grails application will stop and listen for a debug session to be attached and then continue. We can configure a Debug configuration in IntelliJ IDEA (or another IDE) to attach to the waiting Grails application and use breakpoints and other debugging tools like we are used to.
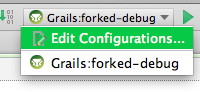
Suppose we have a Grails application named forked-debug and we have created a project in IDEA for this application. We click on the Select Run/Debug Configuration button and select Edit Configurations…:
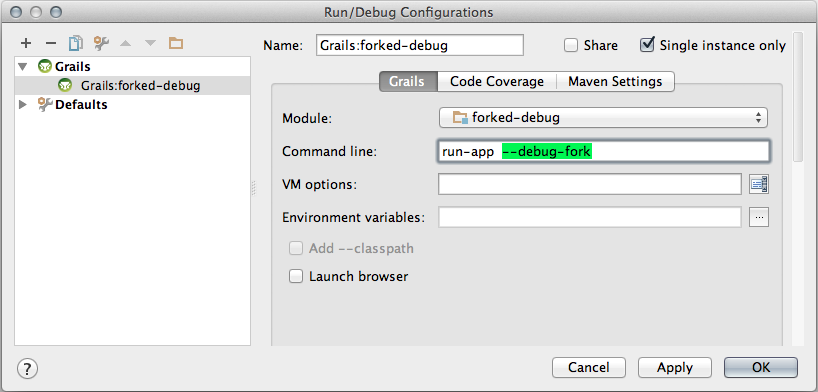
IDEA opens a dialog where we can change the Grails command and set JVM options. We add the option --debug-fork to the Command Line field in this dialog:
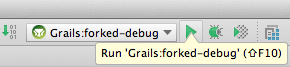
We click the OK button to save our change and close the dialog window. Next we can run our Grails application using our changed run configuration:
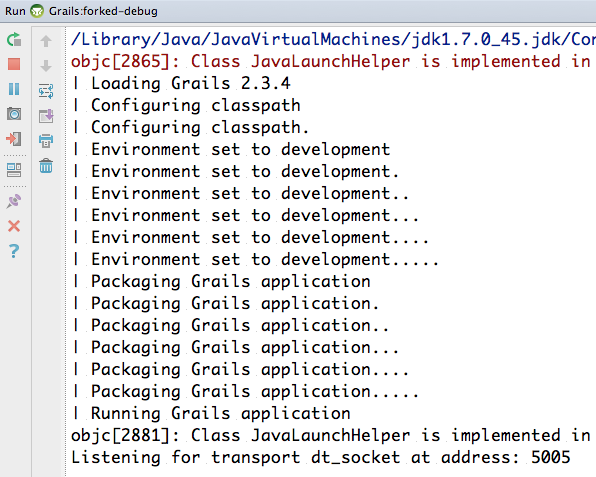
IDEA starts our application in the console window we can see Listening for transport dt_socket at address: 5005:
Now it is time to create a new debug configuration. We click on the Select Run/Debug Configuration button again and select Edit Configurations…. We add a new type of configuration, so we click on the + sign and type Remote:
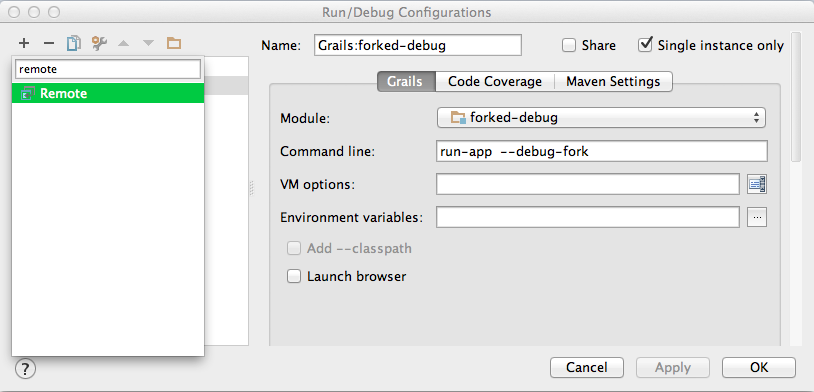
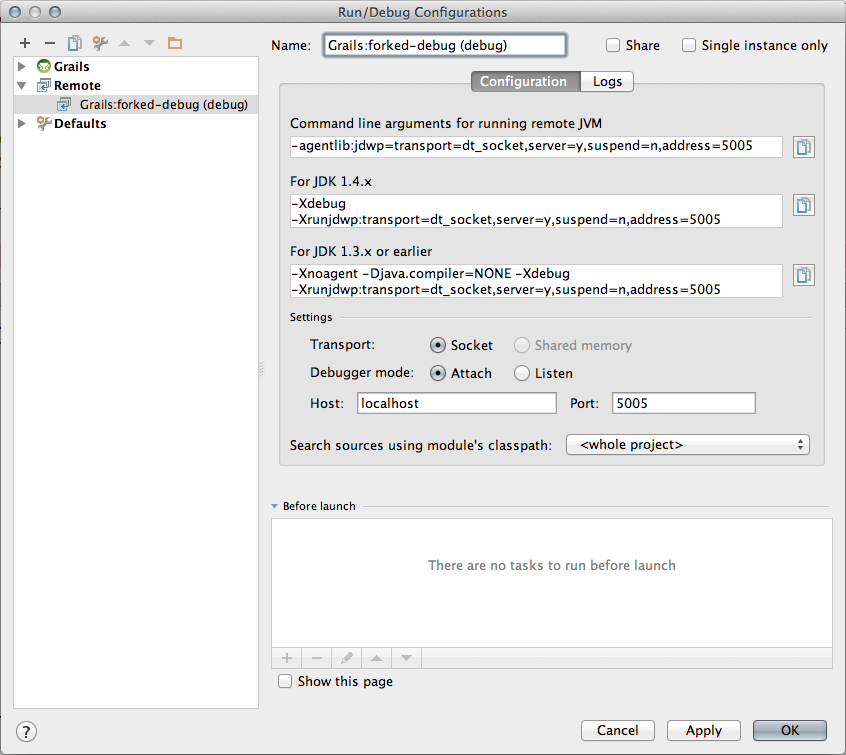
We select the Remote type and the dialog window shows now a lot of input fields which we can leave to the default values. It is good to given this configuration a new name, for example Grails:forked-debug (debug):
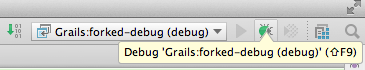
We click the OK button to close the dialog window. Our Grails application is still waiting for a debug session to be attached, so we use our new configuration with the Debug button:
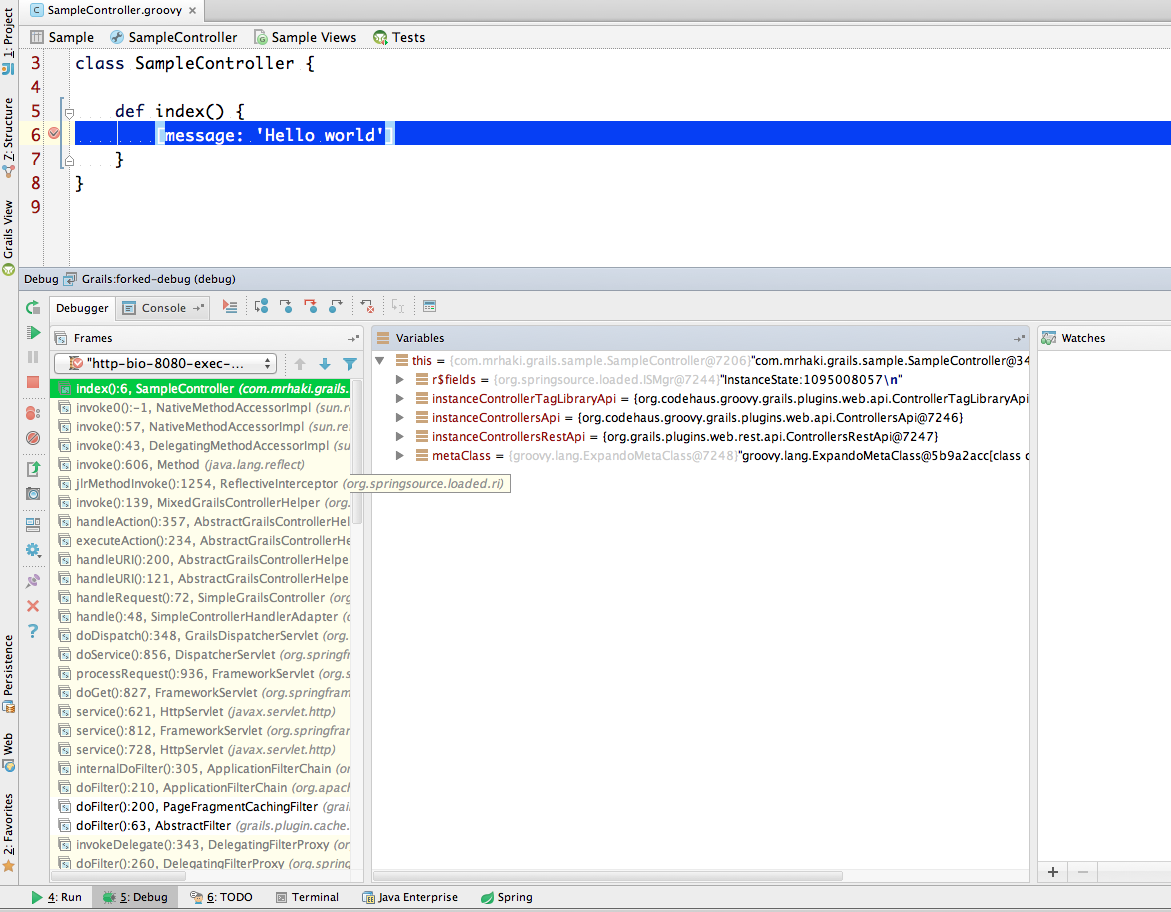
In the console window of our Grails application we can see the application is not continuing to start and finally we can reach the appellation via web browser. We can now place breakpoints in our source code and when we hit them we can use all debugging tools from IDEA:
We could also have used the argument --debug-fork from a command-line and then use the IDEA debug configuration to attach to that instance of the Grails application.
Code written with Grails 2.3.4 and IntelliJ IDEA 13 is used.
Original blog post written on December 11, 2013.
Run Forked Tests in IntelliJ IDEA
In the latest Grails releases we can execute our tests in so-called forked mode. This means a separate JVM is started with an isolated classpath from the Grails build system. When we want to run our tests in forked mode from within IntelliJ IDEA we get the following error: Error running forked test-app: Could not load grails build listener class (Use --stacktrace to see the full trace). To make running tests in forked mode work with IntelliJ IDEA we must add one of the IntelliJ IDEA supplied JAR files to the Grails classpath.
We need to search for the file grails-rt.jar in the directory where we installed IntelliJ IDEA. For example on Mac OSX this would be Applications/IntelliJ IDEA 13.app/plugins/Grails/lib/grails-rt.jar. We need to copy this file to the lib directory of our Grails project. On *nix systems we can actually define a soft link to this location in the lib directory. For example with the following command $ ln -s /Applications/IntelliJ\ IDEA\ 13.app/plugins/Grails/lib/grails-rt.jar lib/intellij-grails-rt.jar.
Now we can run our Grails forked tests from within IntelliJ IDEA. To debug our tests we must add the option --debug-fork to the Run Configuration of the test.
We could also disable the forked mode for tests to run them in IntelliJ IDEA. We must then set grails.project.fork.test = false in grails-app/conf/BuildConfig.groovy. In non-forked mode we don’t need to copy the file grails-rt.jar.
Tested with IntelliJ IDEA 13 and Grails 2.3.5.
Original blog post written on February 10, 2014.