Chapter Five - Backup Attack
“The election of 2020 was not counted, it was calculated.”
—Draza Smith, mathmetician

If the Attack Phase fails, the Backup Attack Phase comes into play.
This is where the story takes an interesting turn which may shake the reader’s previous understanding of how elections work.
For all the years of my life until 2020, I thought my vote counted. Then, in late 2020, I realized it probably didn’t, but I didn’t know how exactly.
Then, sometime in 2021, my perspective drastically (Drazatically) changed when I was introduced to Draza Smith’s work and later met her at the Cyber Symposium. David Clements has described her as an “unsung hero”. I am not keen on the word ‘hero’ generally but that is another topic!
What changed how I viewed elections?
Draza put it well: “The election of 2020 was not counted, it was calculated.”
Start with an electoral college map of the United States. To win the presidential election takes 270 electoral college votes. Then, use a PID controller, like in your thermostat or the cruise control of your car, to generate outcomes at the state level in such a way that the desired candidate wins.
Easier said than done, because you don’t know how many voters will turn out, either for the desired candidate or for the undesired candidate.
Except that you kind of do… We’ve already talked about how many people mailed in their ballots early or showed up early to vote. In Minnesota, there are forty-six (46) days of voting. I don’t know why 45 or 47 days were chosen, but I wasn’t [s]elected to write the laws!
In that 46-day window, data on who is voting is collected. Using historical data in the voter histories, the map of how the state will vote, all the way down to the precinct level, can be projected. As it gets close to election day, the PID controller’s set point can be decided. (In 2020, it appears that overnight when ‘vote-counting stopped in all the swing states because a pipe burst in one of them’ the set point needed to be reset, as shown in the upcoming graphs.)
It’s indeed possible that the original set point in each state might need to be adjusted to get the desired outcome state by state to achieve the electoral college victory for Biden. Again, is this why vote counting needed to suddenly stop in multiple states in the middle of the night?
This part of the book, more than others, requires the visuals, charts, and graphs to be in front of you. If you are listening to the audiobook, print out the pages from the e-book freely available at https://leanpub.com/sim2020/read.
Edison Zero
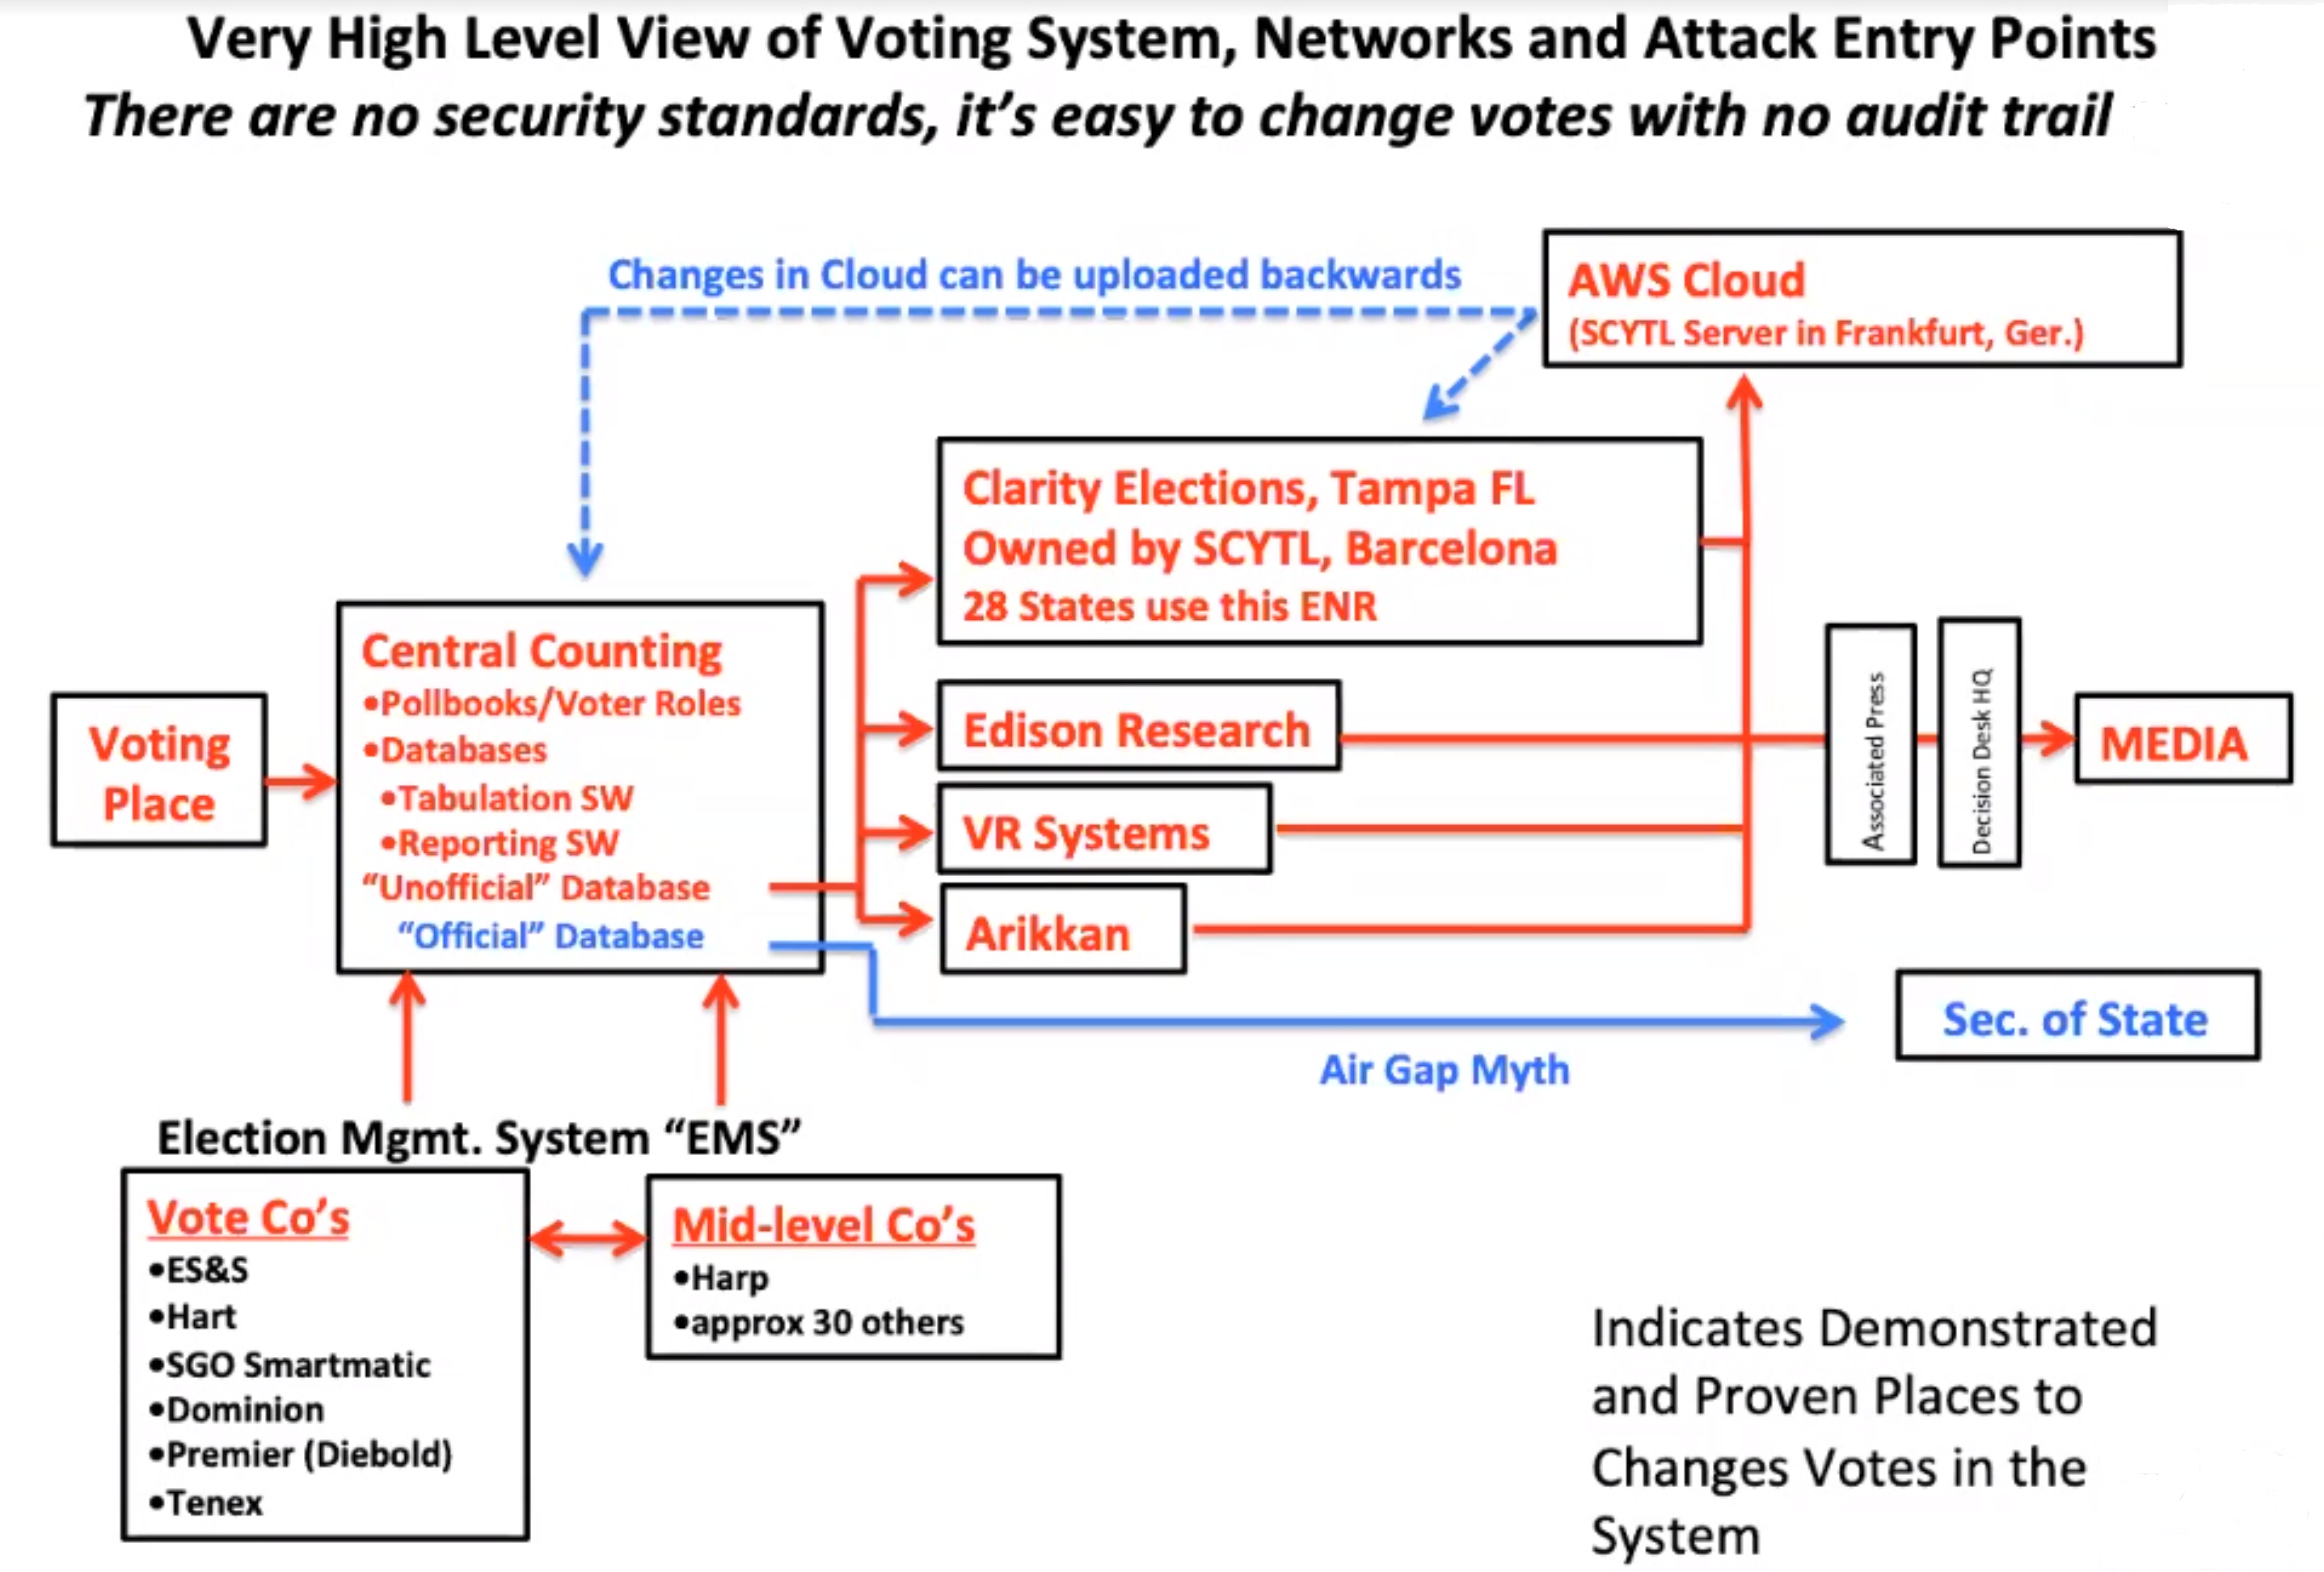
For background on Edison data, recall this chart from Russ Ramsland’s Georgia presentation in December 2020.
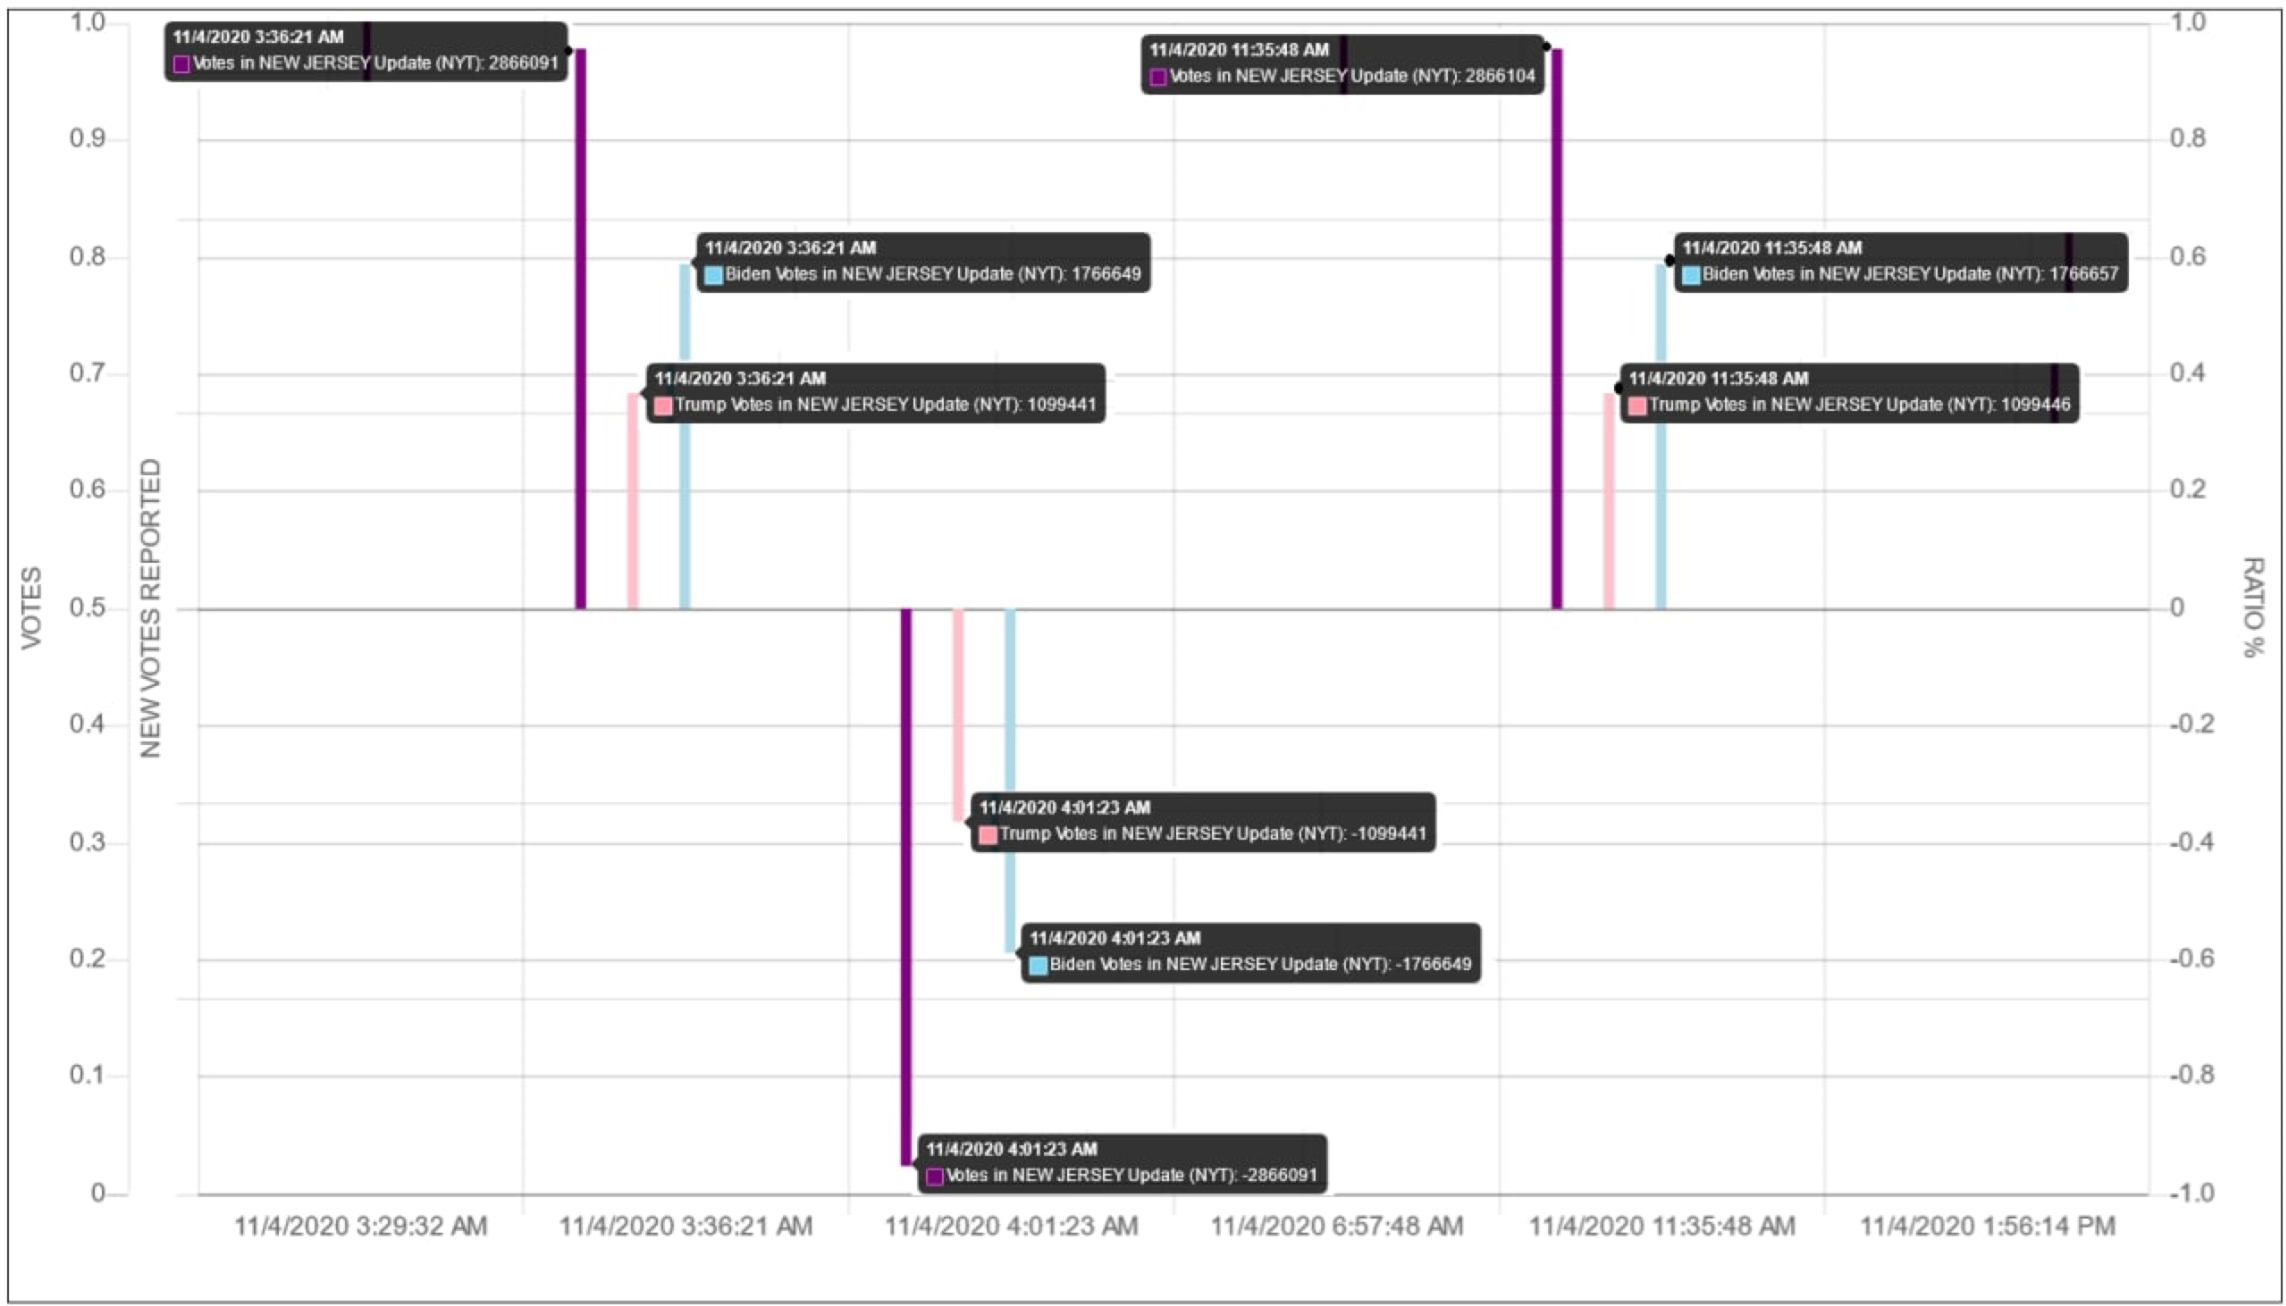
Draza also writes: “For those asking - the Edison data reports the cumulative votes and the percentage that each candidate has during the election. But - during the Nov 2020 election, these reporting values all went through a rolling zero that then returned to relatively the same values on the next reporting cycle. It happened in series to each state and DC. I suspect that this was application of new setpoints and/or new control constants to drive the vote totals to the setpoint within the number of votes remaining in the count.”
Here’s an example of New Jersey’s Edison Zero on November 4, 2020 starting at 4:01:23 AM and lasting until 11:35:48 AM.
Rhode Island
Erin Clements recommended I have a look at Draza’s analysis of the Rhode Island cast vote record (CVR) and compare it with what Edison played on TV. Reason being that it was the “best synopsis of the set point phenomenon and the shuffle because that’s the only place where we have apples to apples comparison between what we were told was happening on election night and what’s actually stored inside the computer system—they can’t be reconciled.”
On Draza Smith’s Telegram channel, all of the following charts and descriptions can be found by using the search function and typing “Rhode Island”.
On August 3, 2021 Draza said: “So - Rhode Island is one of the more surprising plots I have seen so far. During the entire election reporting, the ratio of votes was on the Trump side of the line…until they were slammed down into their setpoint…
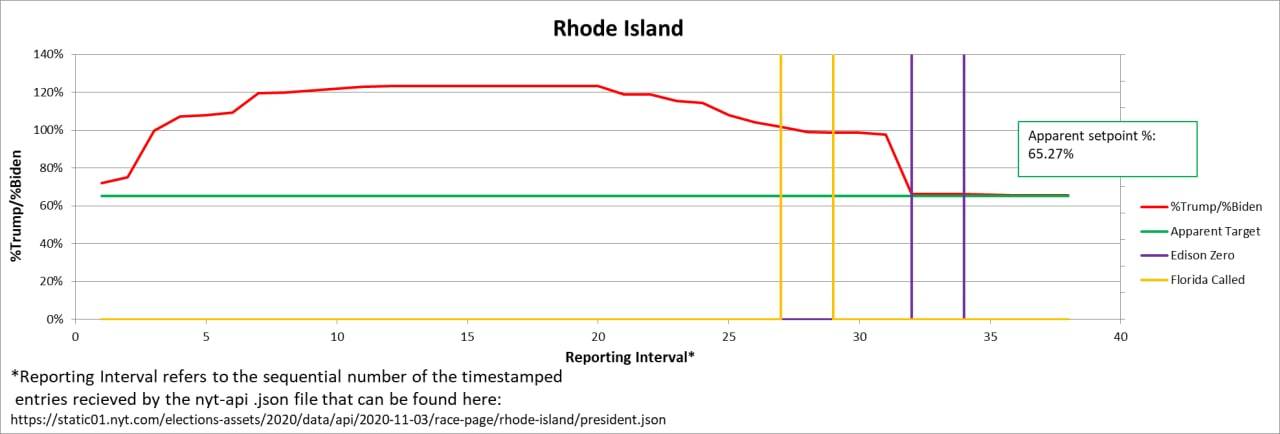
“Looking at the total vote trend, there was a clear preference, until that pesky Edison zero reset….”
“From the Edison reported percentages, you can see the HUGE spike in the Biden votes prior to the reset, which has been indicative of receiving a new setpoint and higher tuning constants.”
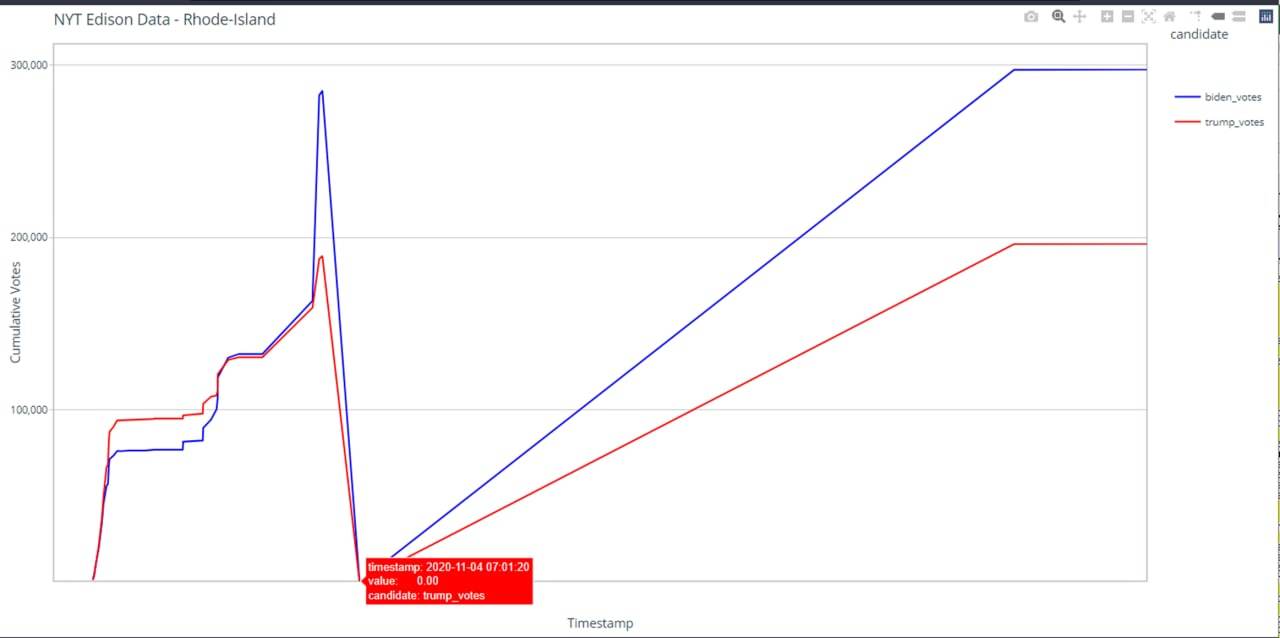
“In the data you can see it happen here. The ratio setpoint is driven from 97% to 66% and the Edison zero happens 4 minutes later.”
Then, on the 21st of May, 2022, Draza announced this:
“I am so grateful our smallest state today. Because the entire state is smaller than many counties in other states, they do things a little more efficiently there, including counting all of their statewide votes with a single system that produces a STATEWIDE CVR.
“So, I have been saying for a while now that I have been confused about the fact that none of our counties/precincts can give a good explanation of how Edison and Scytl and SP are getting the election data to the NYT, etc. for election night reporting and CALLING THE RACES ON!
“But, I believe these companies know the playbook and just provide a probabilistic model to the viewers at home - so how can you question the results? You watched them come in live on TV! All the while the mules and machines and NGO’s with electronic access to the voter rolls/poll books are working magic on the real votes have them end in the same place.”
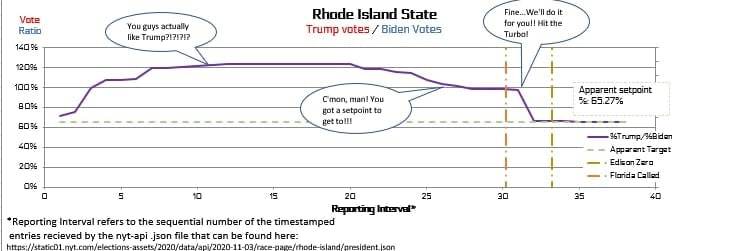
“So, here is the results as we saw them election night for the State of Rhode Island! This is how the ratio of Trump to Biden votes were reported by the news to all of us sitting at home on election night.
“That Drop towards Biden looks a little funny right there after FL was called for Trump, doesn’t it?”
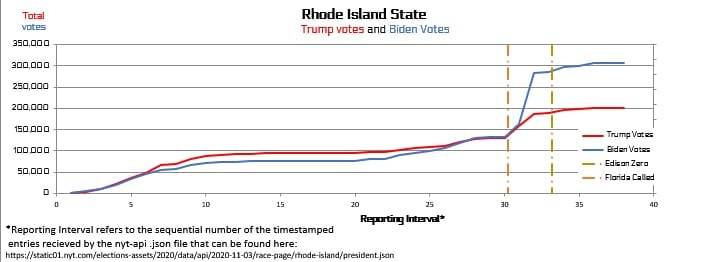
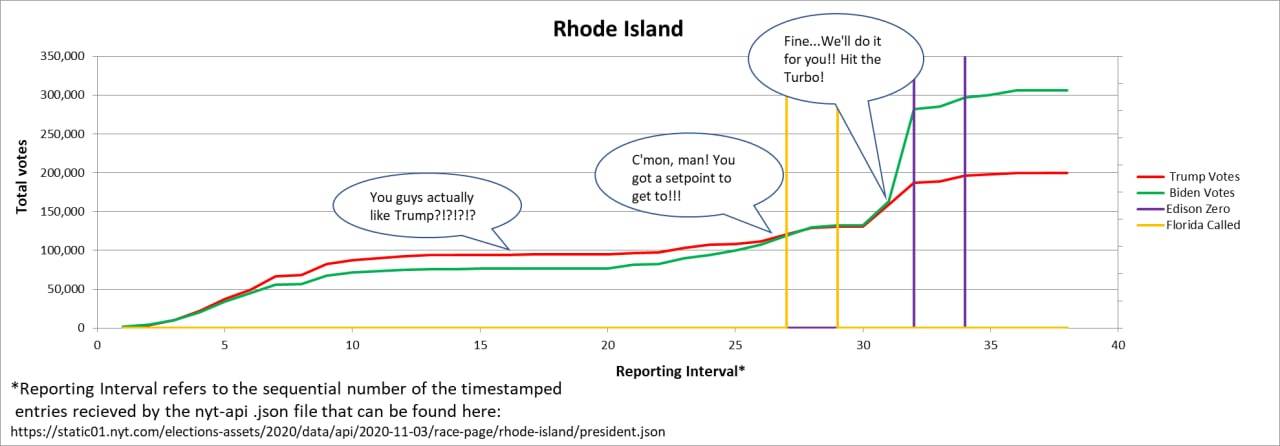
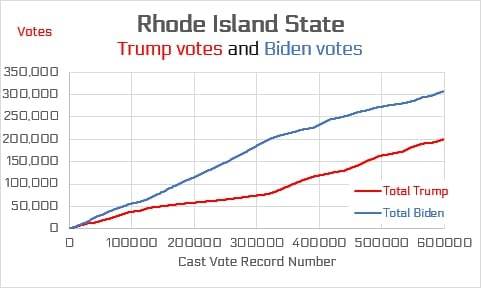
“Here are the actual votes for each candidate that were reported over time. Did you realize little Rhode Island had their very own “F curve”?
“Well, actually it looks kind of like a snake in the grass…”
“So - now we have the CVR data to see what the MACHINE says about how the votes counted up. Before I show the plot, remember what we have learned through the work by Jeff O’Donnell on finding the two sets of books in the database. And my theory that they reshuffle the database to push those muled in votes that come in just under the wire forward in time to make it look like they were always there.
“This produces a distinctive curve with a drop and then a scoop (which Dr. D has termed the “Biden Boost” and then the votes float back upwards to the final setpoint, with corrections here and there. Right?
“Well, even here in RI where it would be totally obvious, the machines could not help themselves. It is in their code.”
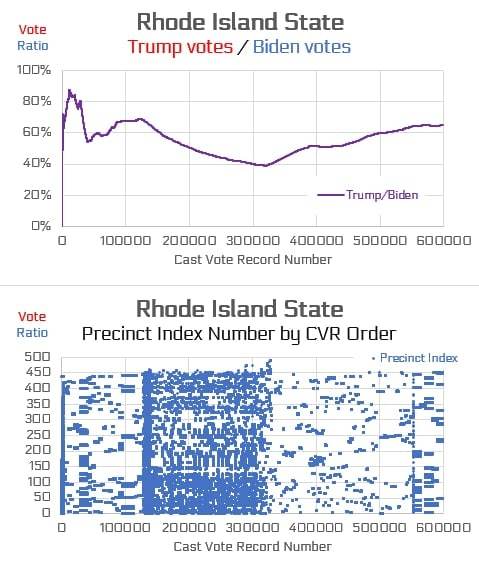
“So - here is what the machine told us with the CVR report of how the ratio of votes ACTUALLY cough, cough came in for Rhode Island over time.
“The blue graph below shows the precinct index that each ballot came in from. This is term I have developed for places that do not have numbered precincts. I take the list of precincts and record the precincts in order as they show up as precincts 1,2,3… and then I can plot them. Anyone that is interested - I can provide you my precinct name-to-number key.
“But what is notable here is - just like in other places, ALL the precincts report in at the very beginning (REPRESENT!) and then are shuffled to look almost too perfectly randomized with keeping some from every precinct in the back pocket to add at the end of counting.
“But - remember - if we were getting in votes perfectly randomized from all over the state - would the Law of Large Numbers dictate that this rollercoaster would be the shape we would expect?”
“And - if you could possible believe it, just look how evenly over time the votes came in for each candidate!! No snakes in the grass here…just in the programmers’ seats.”
“And - believe it or not - those RI Patriots collected more data - interim reports of vote counts, etc. NOTHING MATCHES, not the news data, to the machine data to the SecState data - sure , they all end up in the same place after a month or 2 of making ‘corrections’.”
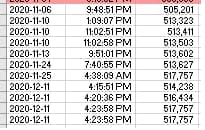
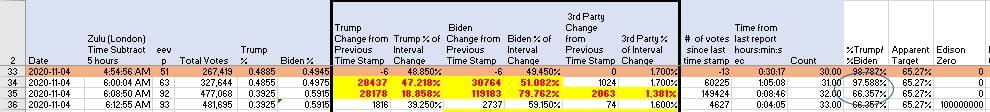
“Check out the corrections that the Edison data made to get to the final results - after over a month worth of “corrections and updates” - because this is how we should count election votes.
“P.S: I dropped out the reported vote from the AP that wasn’t Edison because they appear to not have ben synchronized and make even more crazy jumps, as a result.”
Minnesota’s Simulation
No Minnesotan has been given any cast vote records from their county for 2020 (except for Fillmore County), although these only came in the form of a comma delimited-type file (think .csv or .xls), not in the form of the ballot images themselves which the computers/tabulators read to interpret the voter’s ovals and record the vote tallies. Not being able to produce an audit trail of the machine count, when the machine count is the primary method of counting, is unacceptable AND it puts the public in an awkward situation of not truly knowing whether ANY of their current legislators were fairly elected. Even when recounts are triggered, there is NO audit of the legitimacy of ballots included in the recount and recounts occur days, sometimes weeks, after the election. Again, think back to how easy it was for Rick Weible to order and receive 9,000 ballots from Minnesota operator, Seachange.
Since we do not have the cast vote records from any county, let alone the entire state as Rhode Island was able to produce, let’s make do with what we can.
Let’s start take a look at how votes were reported to the media (refer back to Russ Ramsland’s slide above for reference). The following graphic shows how the votes were sent through to the media from Edison Research. Notice the negative 194,846 votes near interval 50. In a system that is aggregating votes, should there ever be a drop in nearly 200,000 votes? What may have caused that?
Here again I will quote Draza Smith:
“So - Minnesota had some really interesting things going on that took a little bit of thought. I am finding a lot of events that happen across states that help me try to convince all of you our elections are completely controlled events. Minnesota - I believe - kinda went like this:”
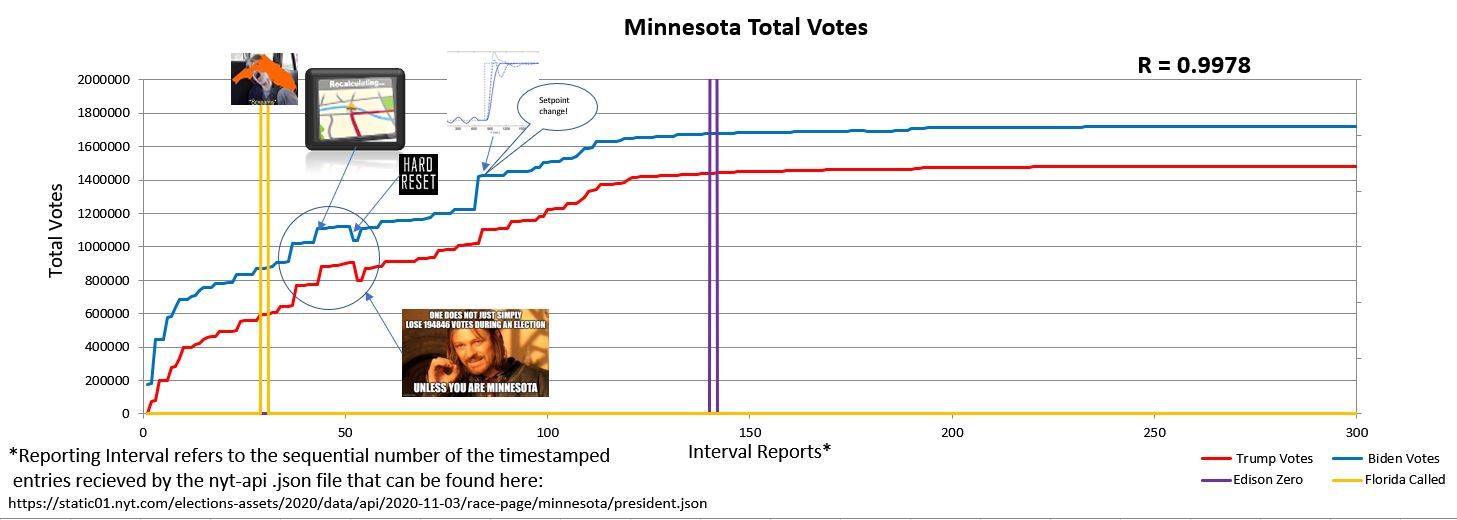
“The overall votes have a very high correlation with an R value of 0.9978, which is higher than Pennsylvania, but Pennsylvania was the states that had the same “event” happen, with regard to the loss of votes during counting. I pulled up the similar curve from Pennsylvania and, not only is the shape factor almost exactly the same, but it happened during almost the same counting interval number - around 50 - which, timewise, was shortly after the Florida surprise.”
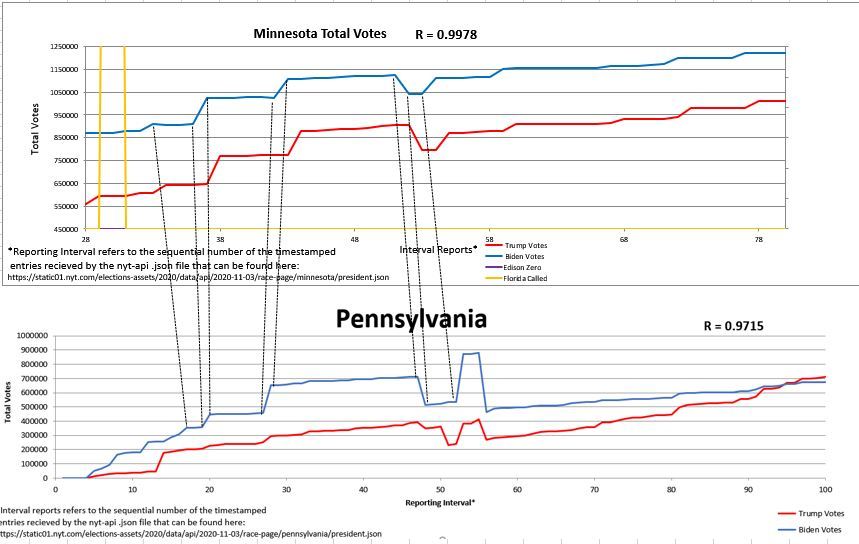
“The difference in the shape that follows whatever was happening that caused the similarity between the events in PA and MN is the result of the difference in the initial perturbation that was assigned to each state. PA had one that was more chaotic that MN.”
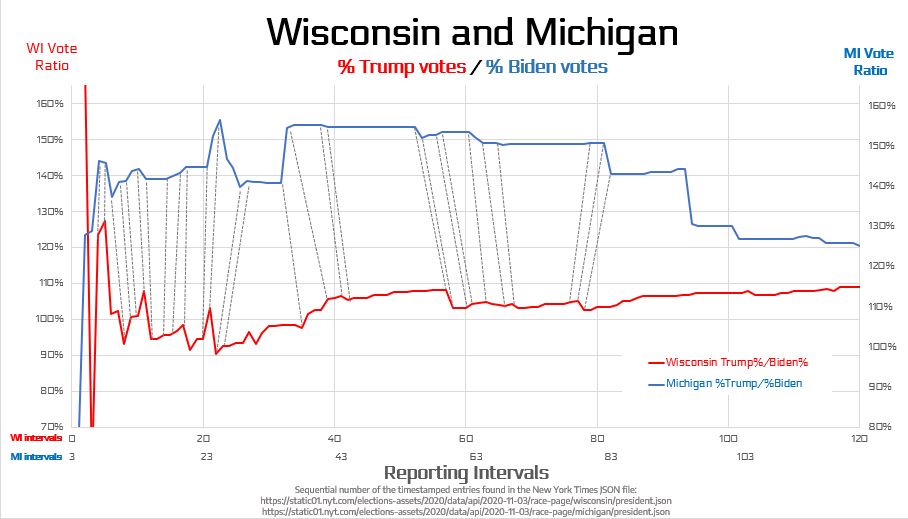
To demonstrate that similarites between states are not isolated, notice Wisconsin compared with Michigan.
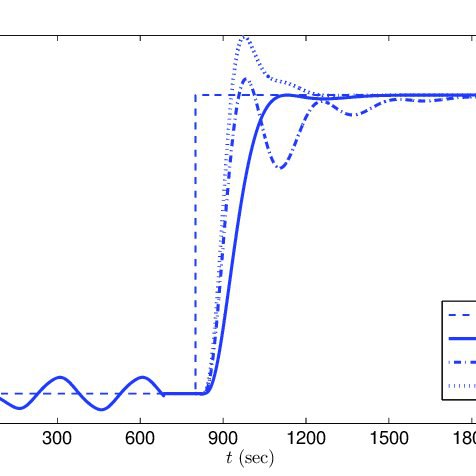
“The “setpoint change” that appears to occur later on is most likely the result of a slight shifting in position as MI was being moved in the lineup. I refer to this as a setpoint change, because it bears a striking resemblance to what we would see in any industrial system that is being controlled and experiences a setpoint change. This is the image that I used on the graph above that - should - have nothing to do with elections.”
When Draza refers to MI (Michigan) being moved in the lineup, consider that since Florida’s Trump turnout was so high the algorithm was not going to be set in such a way to achieve a Biden win. It appears the decision was made by the powers that be to let Trump win Florida but pick up those electoral college votes elsewhere. Thus Michigan being moved in the lineup.
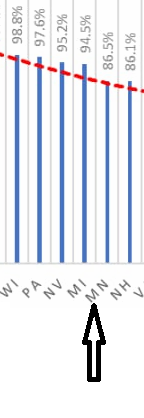
“If we go back and look at the national key calculated from the final values, you can see that MN is right there at the edge of the shuffle - and probably was affected by the moving of MI into the Biden side of the curve.”
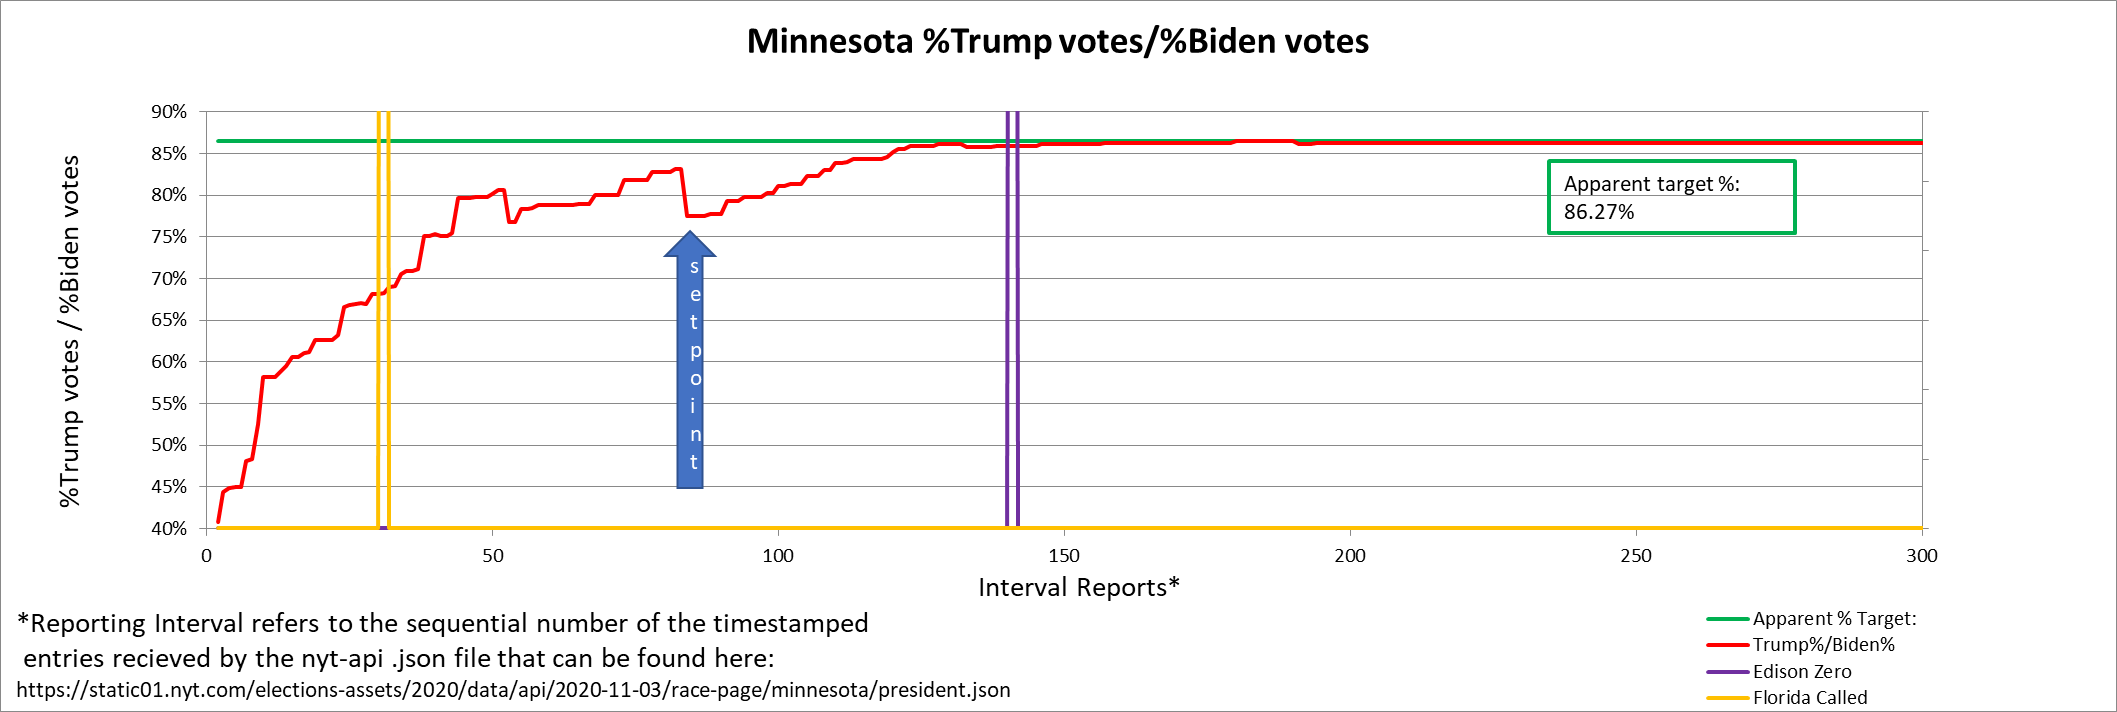
“Here you can see the ratio control curve with a bit of a chaotic start and that “event” after Florida was called. But, after she got her final setpoint, the curve just eased its way into the final setpoint, like we have seen in so many other states.”
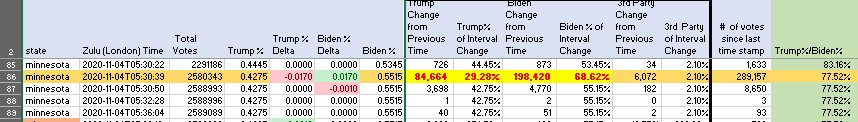
“Now, the adjustment to that final setpoint was really a herculean effort by our vote counters. We were able to report 289157 votes in 17 seconds. This reduced the percentage from 83% to 77% Trump to Biden votes, because Biden received the lion’s share of that valiant effort.”

“So - that number - 194846 - is kinda like the other reductions we have seen in other states. If you take that number and divide it by the total on the line above, it is usually apparent that is it a calculated reduction. If we do that here 194846/2071091 = 9.41% reduction. I would have expected it to be 9.5% of 10%…a nice round reduction like seen in other states. So, I looked as what we have going on. If we look at the reduction in just Trump’s votes, what we have on this line is a reduction coupled with a flip from the 3rd party. If we remove the flip from the 3rd party, we get a reduction of 87049.15 votes from Trump’s tally, which is a 4.20% reduction in Trump’s overall vote at that time.”
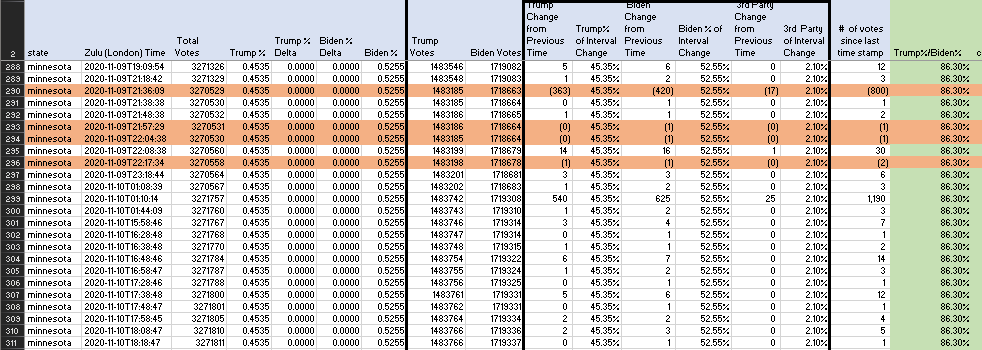
“Annnddd - we finish up, much like the other states. We have our percentage control of the interval hanging tight - while we find places for the reductions to happen, without changing either the interval percentage distribution or the overall percentage ratio. These cleanup reductions are in between the reports that take about 10 minutes for each single vote to be counted. I guess they were tired from the big push earlier.”
Does reviewing this data make the reader look at our election process differently?
I know when I first saw this data I was unsettled—I hadn’t considered this possibility. But with this new information I went forth with new questions.
Remember that the Backup Attack phase is used when the initial attack doesn’t go as planned. The biggest tool is the injection of votes electronically. If this can be done without detection, a race can still be won regardless of how many physical ballots were delivered absentee (dropbox or mail-in) or at the in-person polling place on election day and subsequently scanned through tabulators. In a totalitarian system, election night reporting could be largely or actual theater and disconnected from results aggregated at lower levels; citizens could be shown results and then later barred from auditing election materials altogether and appeased with piecemeal post-election reviews which only review a tiny number of ballots.
There is a theory out there which Draza’s data begins to provide evidence for that the 2020 election was less an election and more a simulation disguised as an election. (This is in part why I made the acronym for the title of this book = SIM.) We don’t need that perspective to lay out the anomalies, indicators, and evidence we’ve done up to this point in the book, but it does serve to provide a working explanation for the irregularities reported around the state and in the Edison Research data. Data is only as good as its source.
Once the simulation concept is understood, lower level manipulation can occur in the databases or voting machines in counties and precincts to achieve results at that lower level which align with the top-down algorithms. This may be part of the reason the Office of the Secretary of State in Minnesota stops providing absentee data a few days before elections and does not provide it until a few days after. Meanwhile, the official results don’t have to reconcile or match the Statewide Voter Registration System until about 6 weeks post-election, AFTER the MN State Canvassing Board has certified the election. Indeed.
Case in point: Around September 2021, I remember video calls where Jeffrey O’Donnell and Dan Sundin shared preliminary findings from the before and after server images revealed by Tina Peters on Days 1 and 2 of Lindell’s Cyber Symposium (see the documentary Selection Code for more details). To this day I encounter folks who were disappointed by the event in Sioux Falls: I may share their confusion regarding the PCAPs but I will not hesitate to point them to the three Mesa reports.
When I first spoke publicly at the Sherburne County Commissioner board meeting on April 19, 2022, I mentioned some of the findings of the third report. (Others had already begun to do so.)
It turns out that the government does the election administration work and needs to prove that its work is sound, although refuses to do so. It isn’t for We the People without access to the information to make that case… although we have had to do so because of non-compliance from those whom are meant to serve us.
If the cover up in the Defense Phase, which we turn to next, is good enough, then many citizens will not immediately be able to find out exactly how subversion of their elections took place.