2 .NET
This section has the following chapters:
- Tool-_View.NET_Assembly_References_Mappings.exe.md
- WinDbg,Cdb,_Sun-Of-Strike_and_Util-Start_SoSNet(O2_Version).exe.md
2.1 Tool - View .NET Assembly References Mappings.exe
Here is a ‘simple’ .Net mini-tool that shows two TreeViews with .Net assemblies reference’s dependencies (I used it today to figure out how many dependencies a particular dll had).
You can download this O2 Platform tool from: Tool - View .NET Assembly References Mappings.exe (5Mb)
Here is what it looks when executed for the first time:

On the left you have the original assembly (in this can the actual Tool - View .NET Assembly References Mappings.exe) and the dlls it depends on.
On the right you have the XRef mappings of each assembly loaded on the right:

Where this gets interesting is if you drop a folder into the left-hand-side TreeView:

All dlls are loaded (on the left) and the XRefs (on the right) show more mappings:

The loading and mapping of dlls is very quick, for example it took about 2 seconds to load and map 81 assemblies:

The ‘REPL Selected Assembly’_ ToolStrip Button**, will open a C# REPL for the assembly selected (on the left **_TreeView)
For example here is the AWSSDK.dll assembly:

Once we have a dll loaded, we can (for example) list it classes using reflection:

**Note 1: **you probably noticed that I used and packaged ILSpy (in order to use Mono.Cecil) as one of the dependencies, so a cool improvement of this script would be to fire up ILSpy from here, or even better to show its main decompilation GUI (TreeView and decompiled code).
**Note 2: **The script that created this tools is at GitHub: Tool - View .NET Assembly References Mappings.h2
2.2 WinDbg, Cdb, Sun-Of-Strike and Util - Start SoSNet (O2 Version).exe
If you are want to manipulate or analyze a .Net in real time, one of the best options is to use the .Net debugging API, and the best way to do that is to use the cdb.exe utility (downloadable from here) with the SoS (Sun-Of-Strike) managed debugger extension
A while back I found the SoSNet project (which was a gui on top of Sos) from https://bitbucket.org/grozeille/sosnet which I then forked into https://github.com/o2platform/O2_Fork_SoS_Net/ in order to allow it to compile under Roslyn (and add a couple other changes/fixes)
If you want to give this tool a test drive here is an stand-alone exe: Util - Start SoSNet (O2 Version) v1.0.exe (created from the _Util - Start SoSNet (O2 Version).h2 _script), which you can see in action at the end of this post.
If you don’t know (or have used) SoS, you are missing a massive trick!!! You will get FULL access to the CLR, and there is no .Net object that you can’t access (or manipulate). It is spectacularly powerful, and you will never do .Net debugging the same way again. And with the O2 modules/tools and the SunOfStrikeAPI.cs , it can now be scripted in a REPL environment :)
See the Scripting SoS (Sun-of-Strike) .Net managed extension using O2 post for detailed examples on how to script SoS in a real-time REPL environment (you might also like the Scripting MDbg and DbgHostLib post).
For more on SoS see:
- SOS Debugging Extension v2.0 (SOS.dll) and SOS.dll v.4.0 (SOS Debugging Extension)
- SoS cheatsheet
- Sending an SOS
- Special Command—Editing memory with a, eb, ed, ew, eza, ezu
- Updating .NET String in memory with Windbg
- How to set breakpoint in windbg for managed code
- Setting breakpoints in .net code using !bpmd
- Get Started: Debugging Memory Related Issues in .Net Application Using WinDBG and SOS
- http://netinverse.com/devblogs/sos-son-of-strike/ (lots of SoS posts)
- The Immediate Window: Running WinDbg and SOS (Son of Strike) Commands (if you are using Visualstudio)
- Debugging .NET 4.0 applications using SOS extension
- Son of Strike (SOS) (old but lots of good examples of SoS commands in action)
- SOS – “Son of Strike” by Mark Smith
A related technique is the one show in the Video: Injecting C# DLLs into Managed (C#) and Unmanaged (C++) processes (where .Net assemblies are injected into another .NET process)
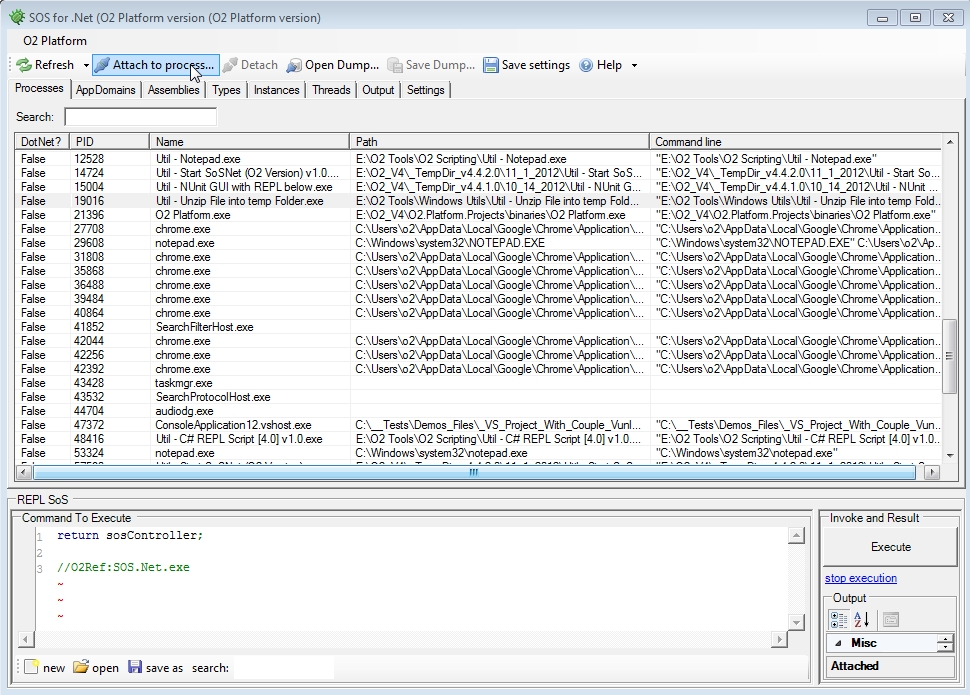
Screenshots of Util - Start SoSNet (O2 Version) v1.0.exe in action:
**
**Default Gui (note the extra O2 Menu and REPL script below)
**
**

Listing current processes and selecting an .Net process to attach
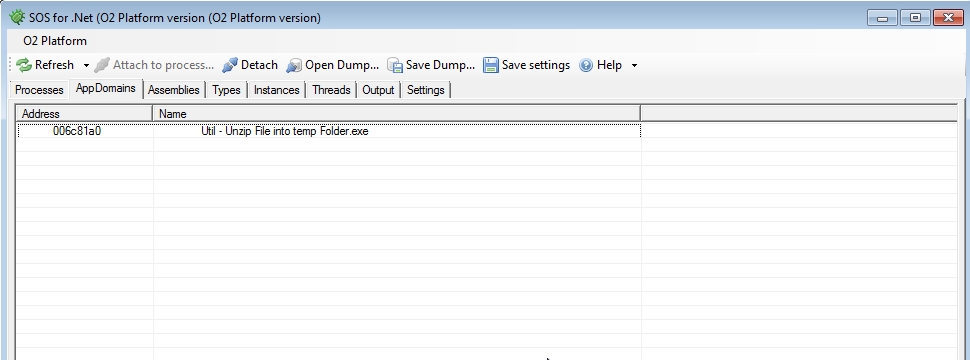
Once attached you can see a list of AppDomains (which you can select one)
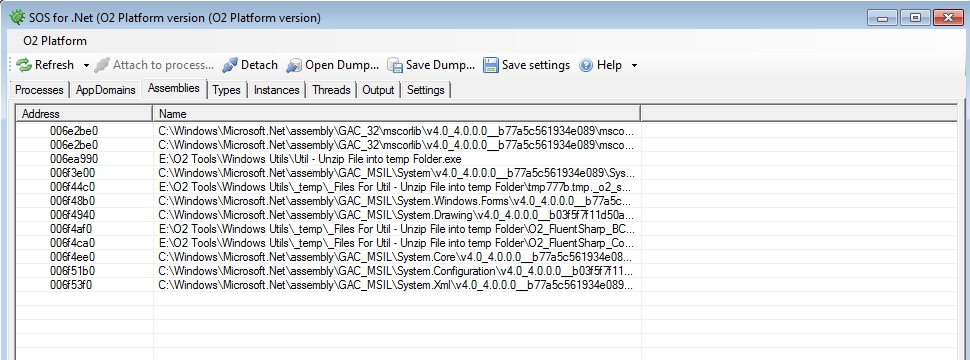
Here is the list of loaded assemblies
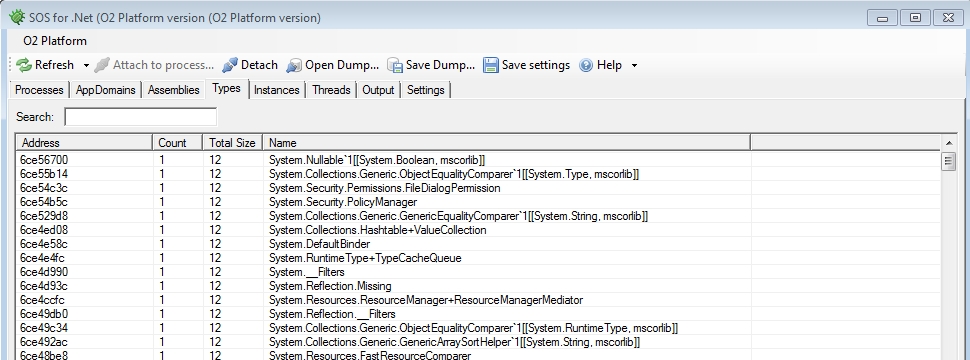
Here are the current types in the selected AppDomain
If you chose a type you get to see its instances
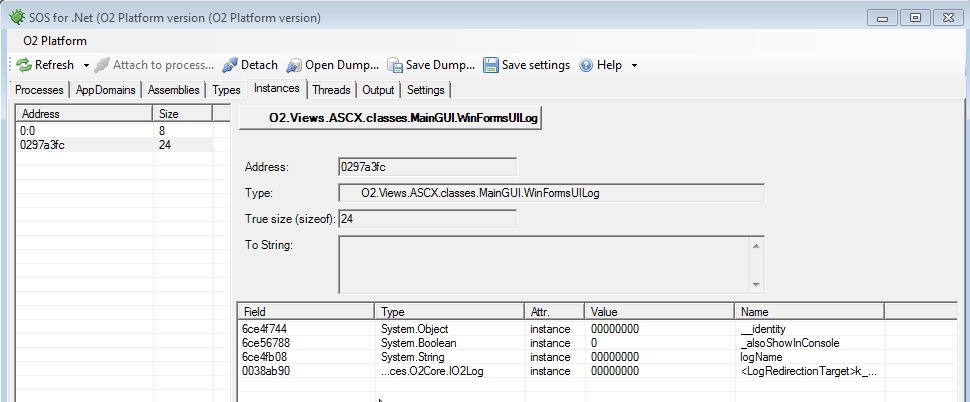
Here is what is happening under the hood (i.e. the cdb.exe output)
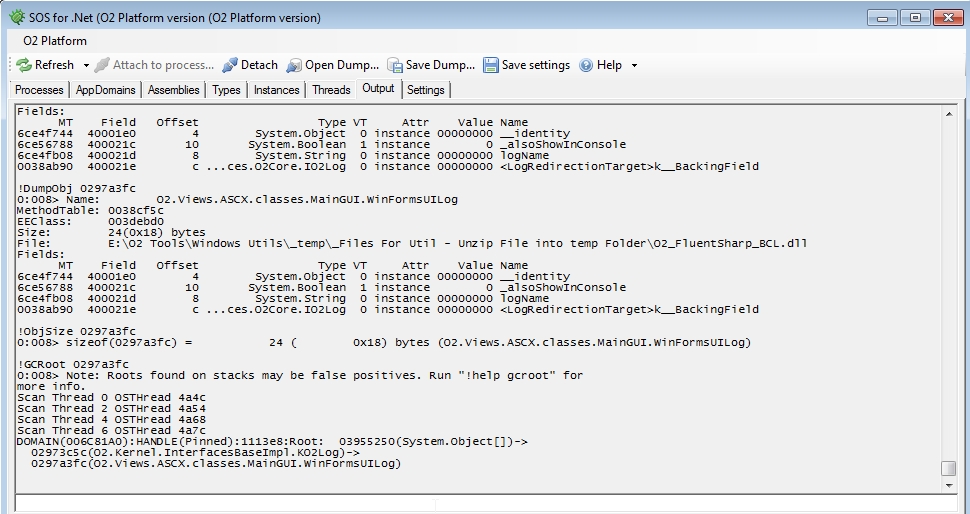
Type !help (in the textbox at the bottom) to see the list of available commands:

Settings page with links to download the latest version of Cdb/WinDbg

**
**