Section:19 s290 - Sub-Section 19 [[Planning For Real A Short Non-Exam Interlude]]
![Section:19 s290 - Sub-Section 19 [[Planning For Real A Short Non-Exam Interlude]]](/preview_site_images/passingprince2exams/missing.png)
§19 V1 (290 of 454)::Sub-Section [[Planning For Real A Short Non-Exam Interlude]]::
If you’re an experienced PMBoK-Guide or Agile practitioner who has no trouble facilitating group planning sessions the next 8 graphics can be skipped without cost.
- They may give you some value
If your new to all things project management then these 8 slides are a lightning fast tour of basic planning tools that apply to any planning session agile or not.
- All that changes is the diagramming conventions and the scale of application. The purpose and team dynamics are the same in all contexts
- The 9th graphic et. seq. are the map of Plan-A16 involvement in the p2 activities so vital reference for everyone.
~~
§19 s291 = Tasks in PDM/ Network Diagrams
§19 V2 (291 of 454)::Tasks in PDM/ Network Diagrams::
Everything that we cover from now to the end of the chapter is the summary of things we’ve already covered, and are marked ‘Not Examined’ in the official manual and syllabus.
- I’ll explore them briefly here with reference to the diagramming conventions that are useful for planning in reality although they are additional to what you need to pass the PRINCE2 Foundation and Practitioner Exams.
- If your focus is squarely on an exam pass you can skip forward to the two Syllabus Summary on a Sheet about 7 slides ahead
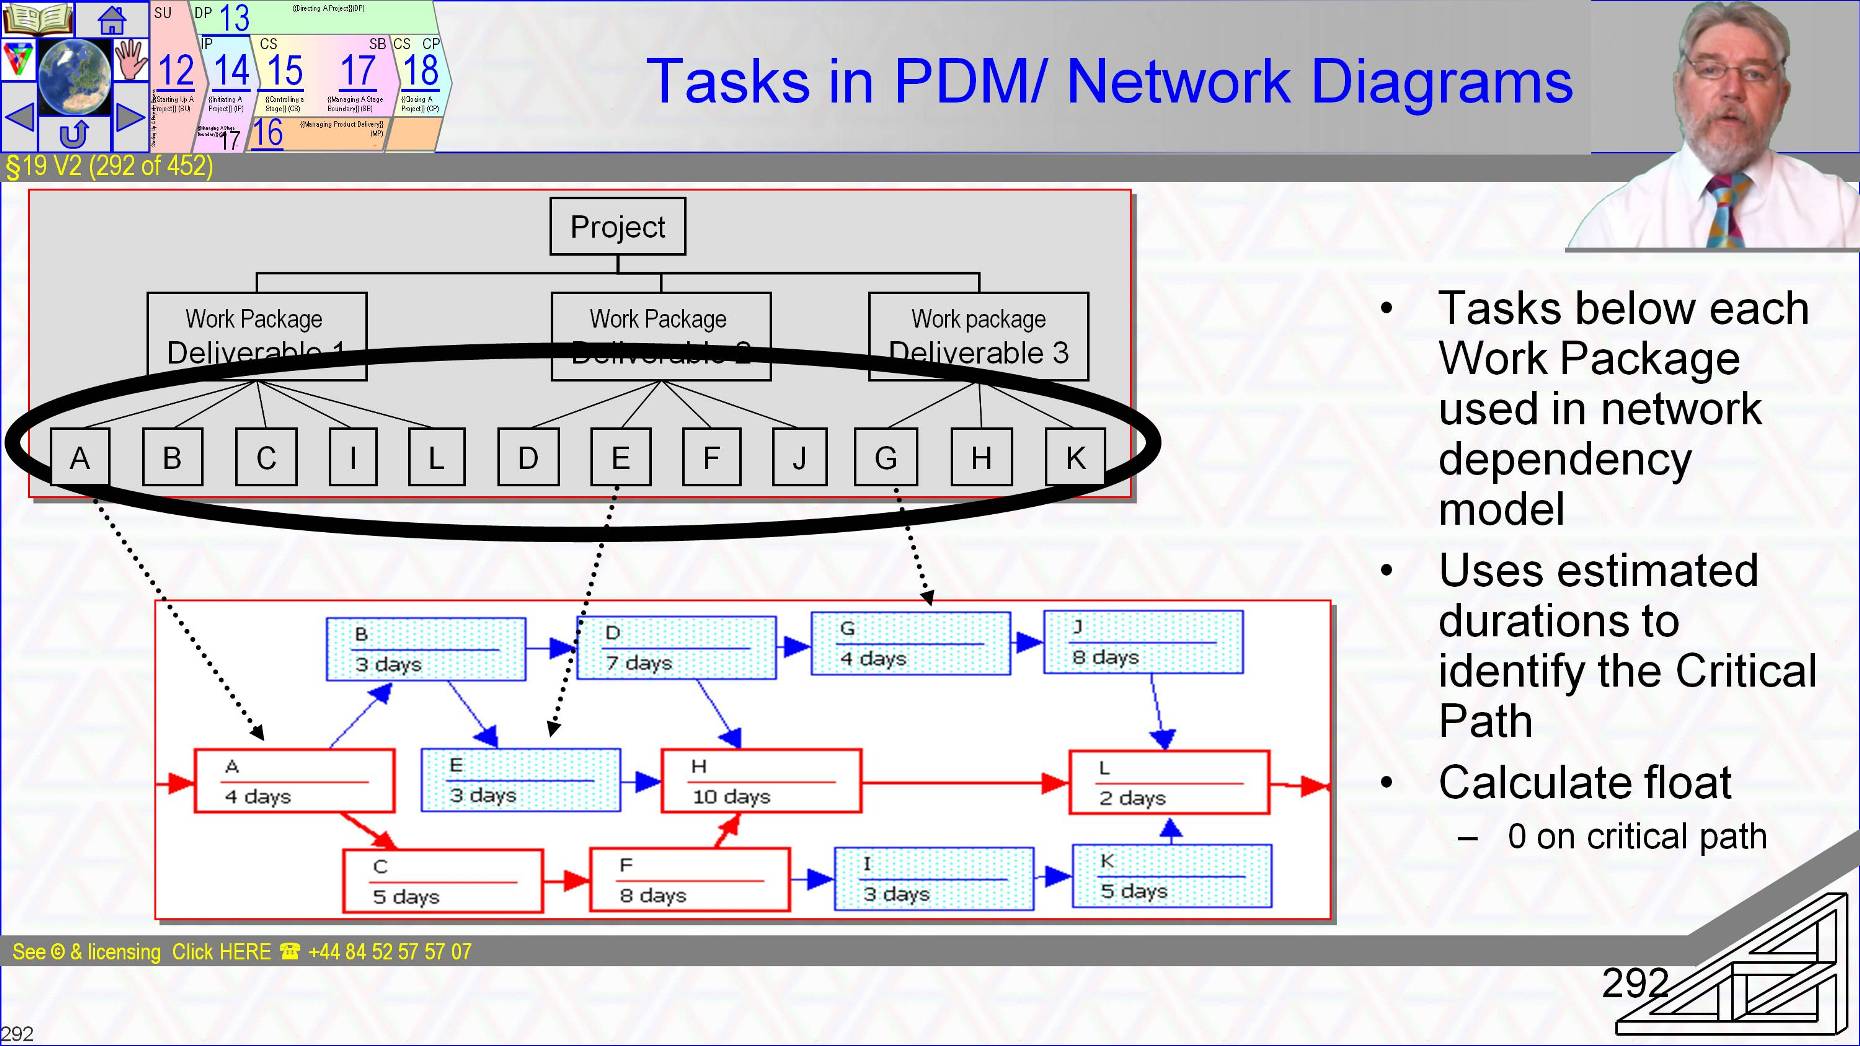
The scope of a Work Package in the Product Breakdown Structure is described using nouns, the name of what is to be delivered in the customer’s vocabulary and documented in detail by p2 as a Product Descriptions.
- The Work Package-A26 is the tasks to create the products and also references the PRINCE2 controls to be used in administering the work package.
- It’s a simple step from result-required – the items in the Product Breakdown Structure with Product Description-A17 to skills to deliver it and thus tasks or activities to create the result.
- It is then a simple task to determine the dependencies between tasks in an Activity On The Node or precedence model.
- Every piece of planning software I know supports A-o-N dependency type of Finish-Start, start to finish, finish to finish and start to start.
~~
§19 s292 = Network Diagram
§19 V3 (292 of 454)::Network Diagram::
§19 s294 = Network Diagram to Resource Gantt
§19 V4 (294 of 454)::Network Diagram to Resource Gantt::
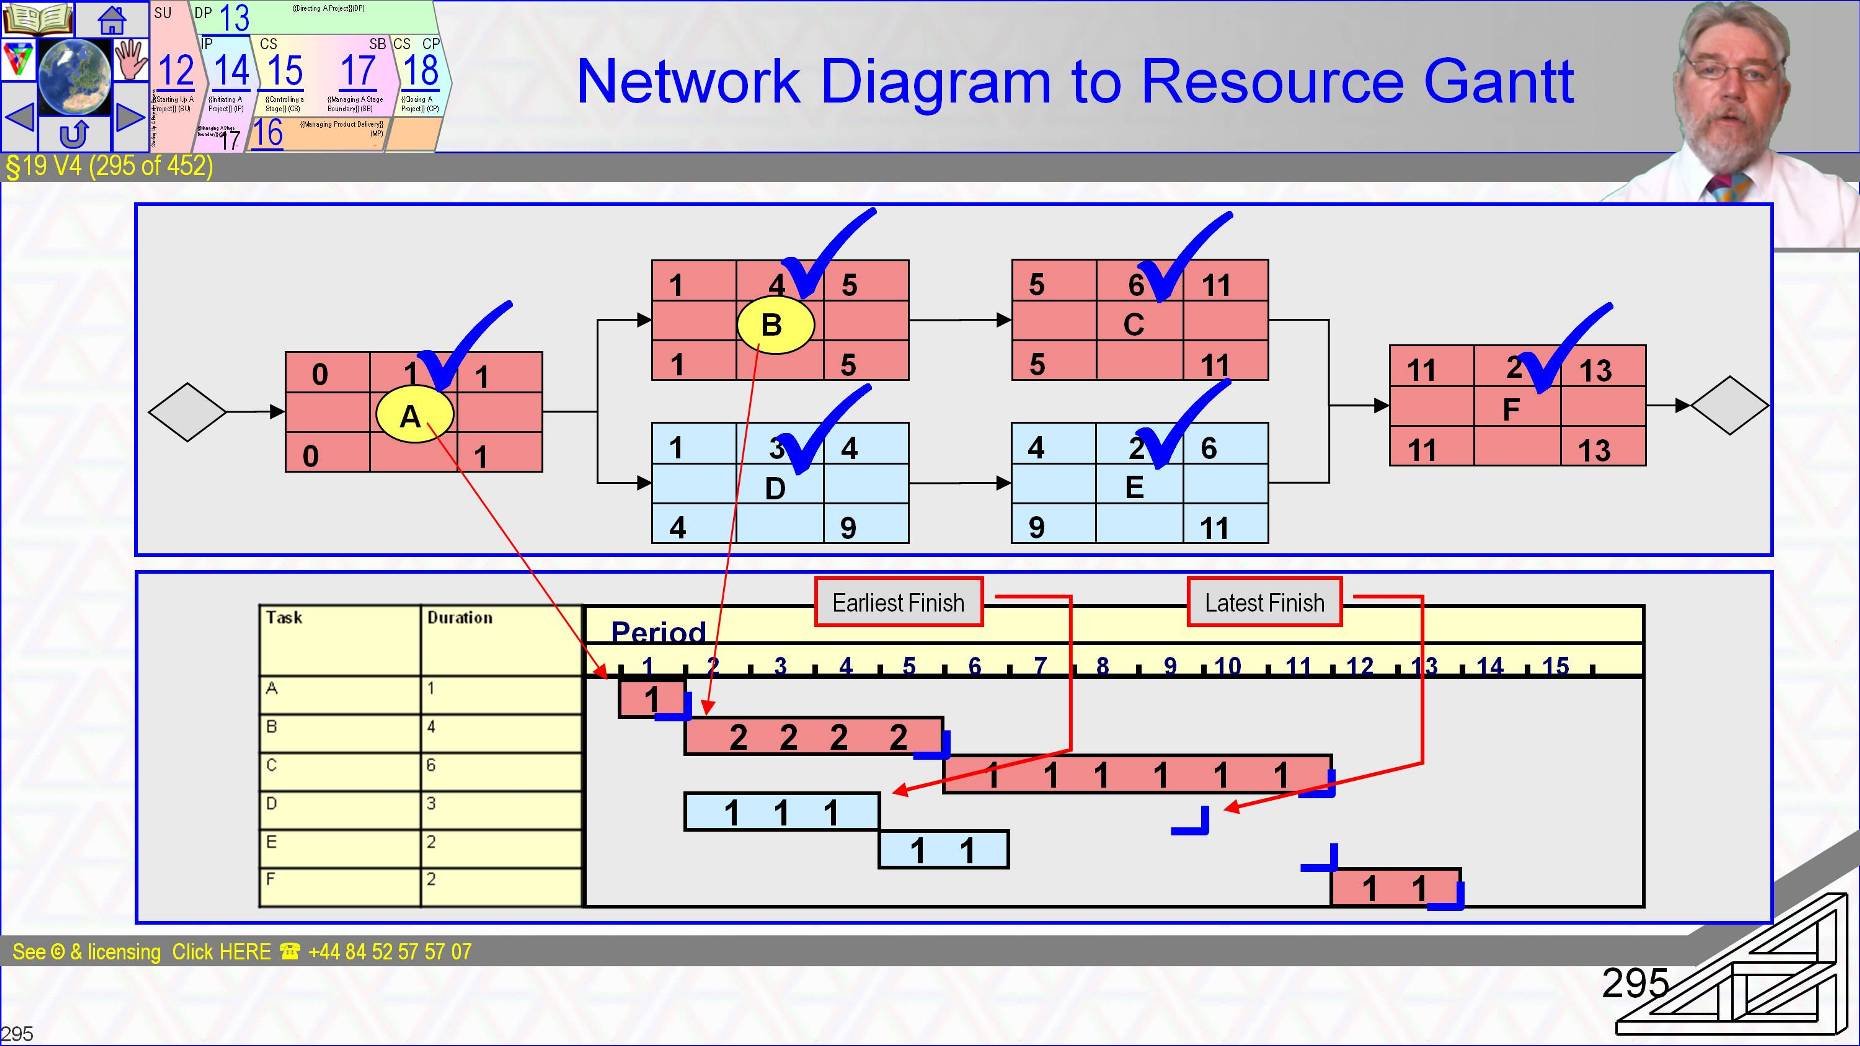
Transcription of the network to Gantt is very simple and software does it at computer speeds
- Both tools network and Gantt have benefits and drawbacks but we will ignore that discussion here – It is in our basic planning courses.
- Once in Gantt format the determination of resource profiles by resource type is easily determined
§19 s295 = Resource Gantt to Resource Histogram
§19 V5 (295 of 454)::Resource Gantt to Resource Histogram::
And easily shown as a time phased resource histogram.
In reality different resource types would each have their own profile of demand over time.
Once the profile is established it can be compared with availability and where practical tasks rescheduled within float to accommodate peaks and troughs in demand.
Levelling aims to make efficient use of resources assigned
~~
[[[ToDo: new]]
§19 s296 = Resource Levelling
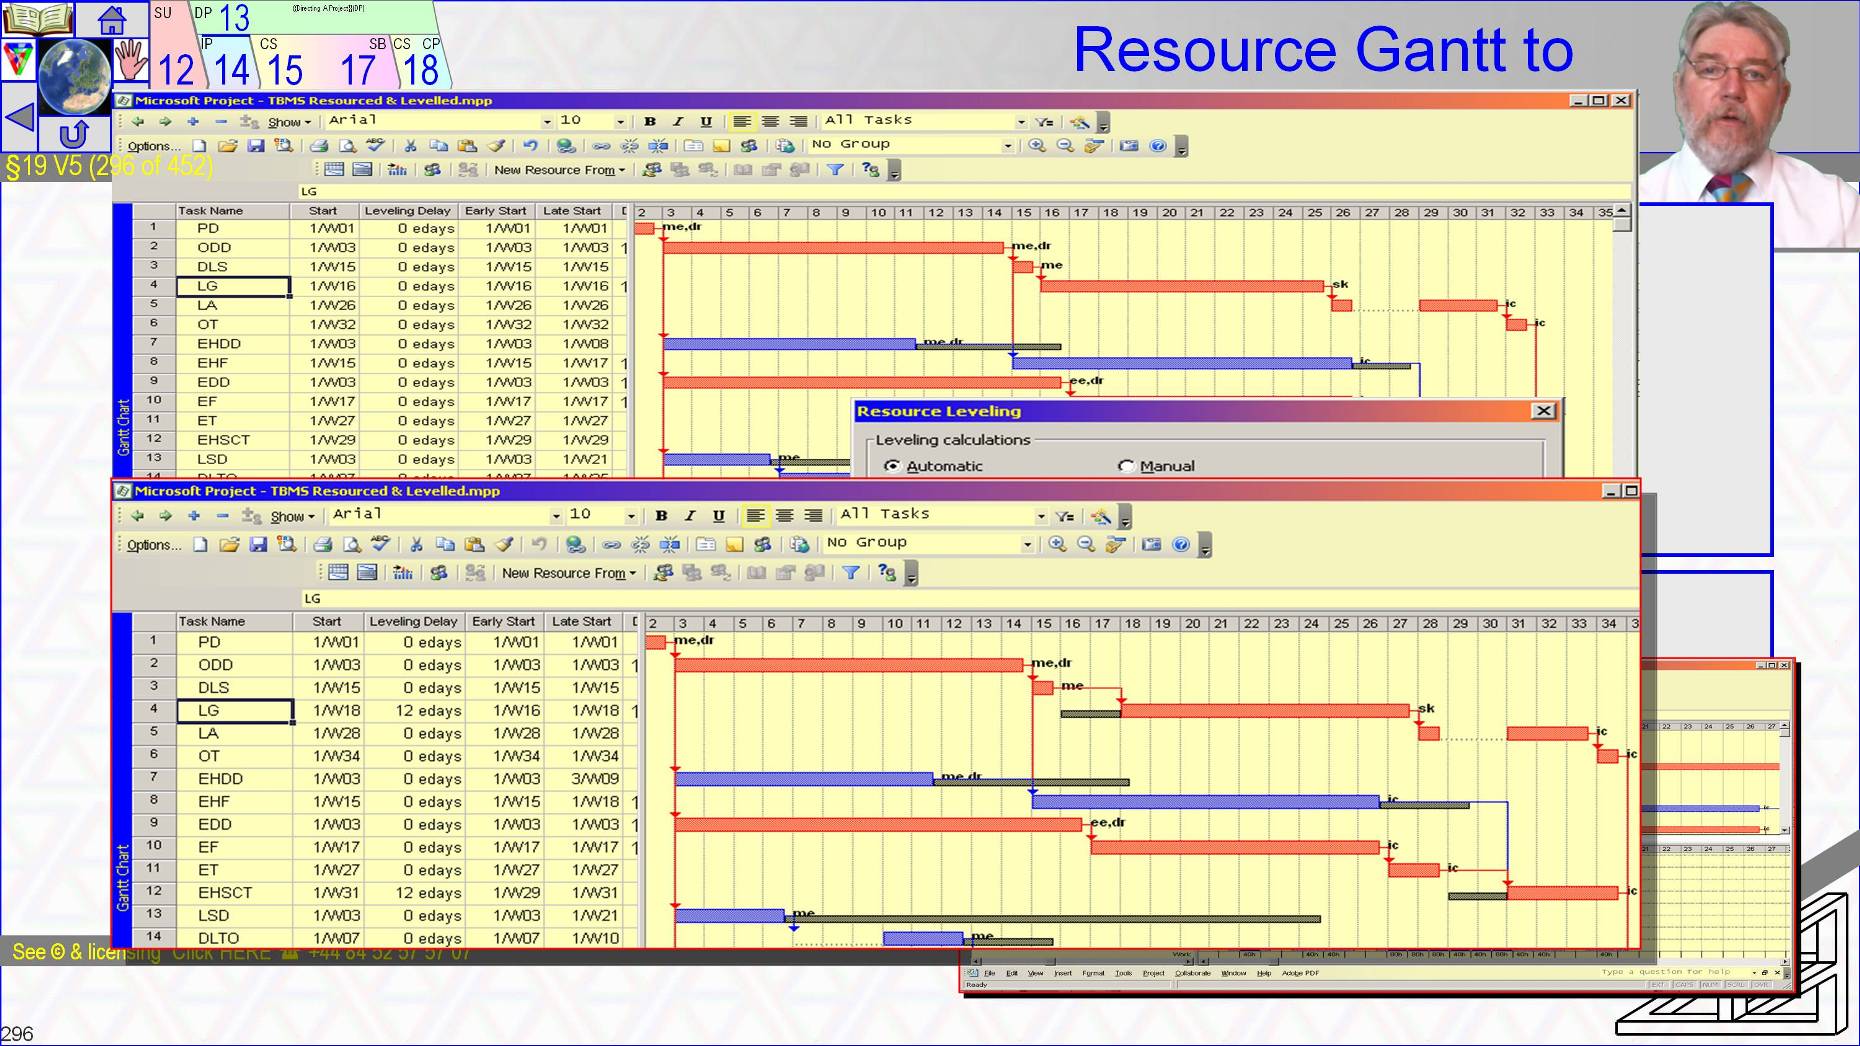
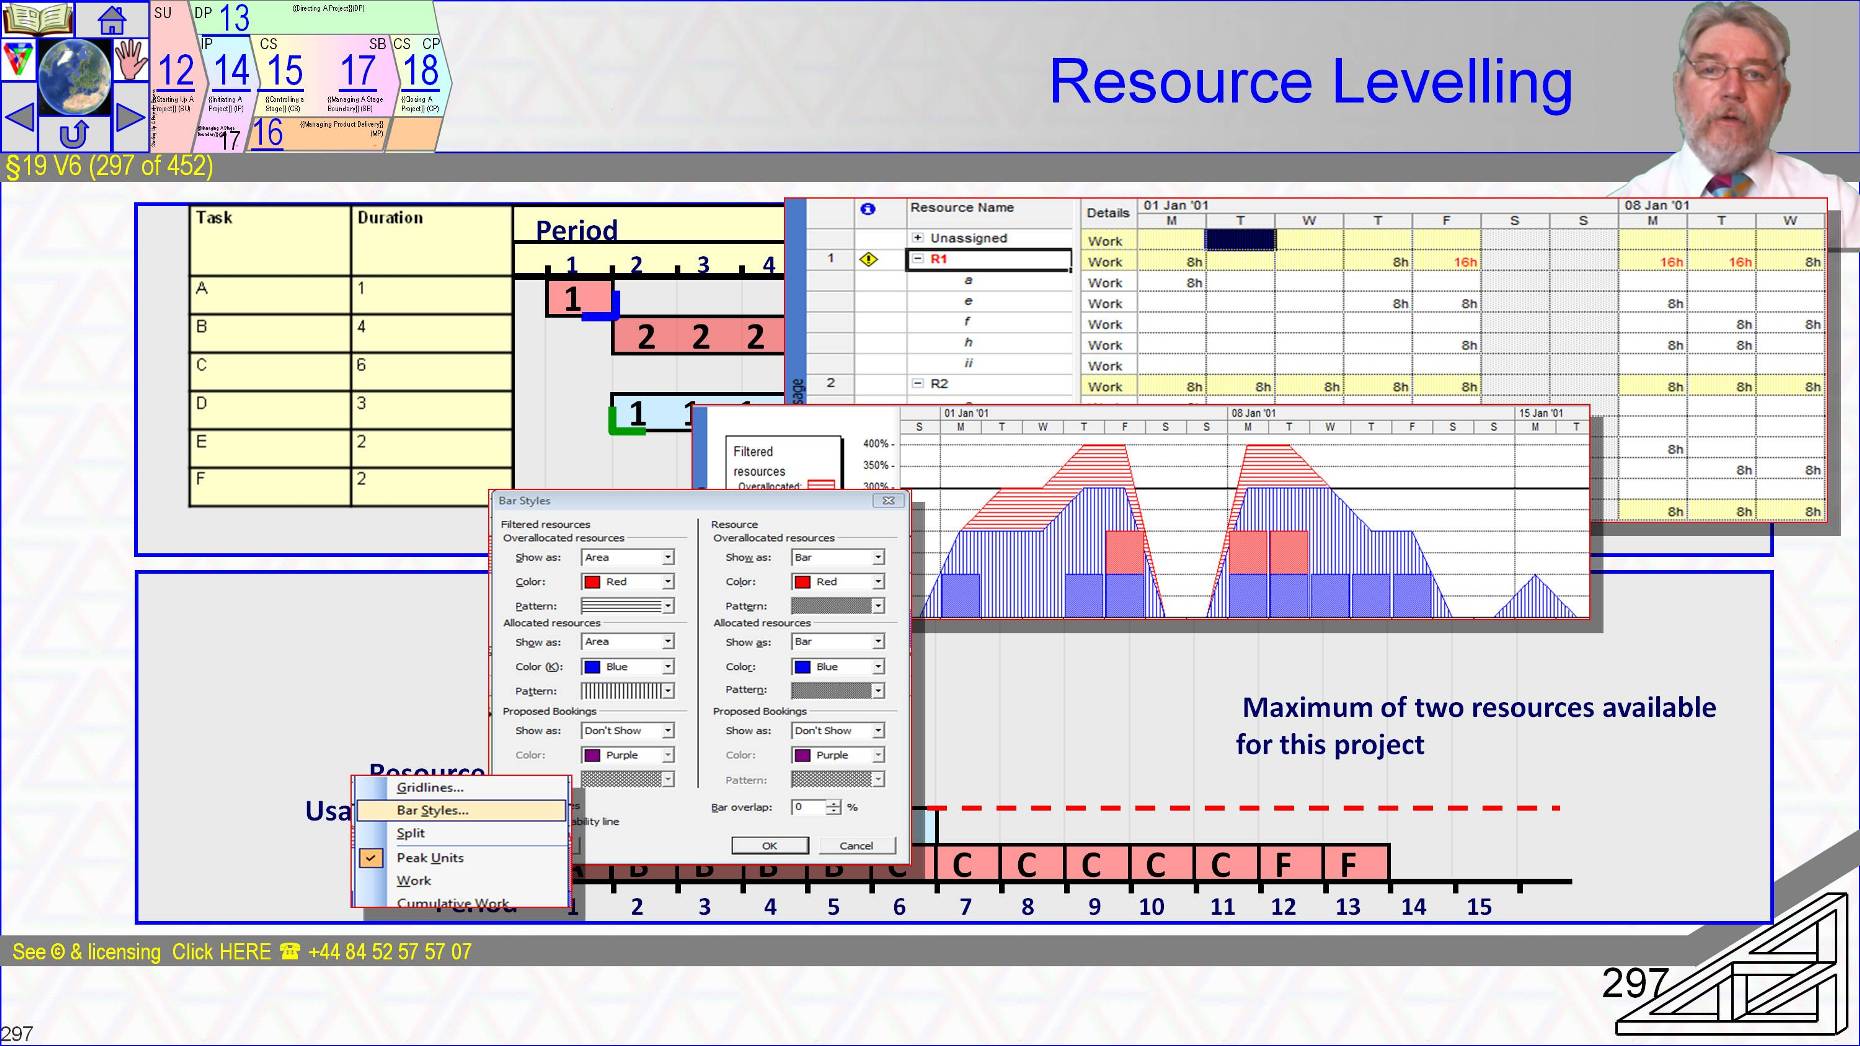
§19 V6 (296 of 454):: Resource Levelling::
We aim where possible to level by rescheduling tasks using their float as if it was a project resource
- It’s nice when things work out neatly like this diagram but they don’t often.
Of course software supports the process.
- Details of how to use software like Microsoft Project to do this are on our website.
~~
§19 s297 = Cumulative Resources & Timing
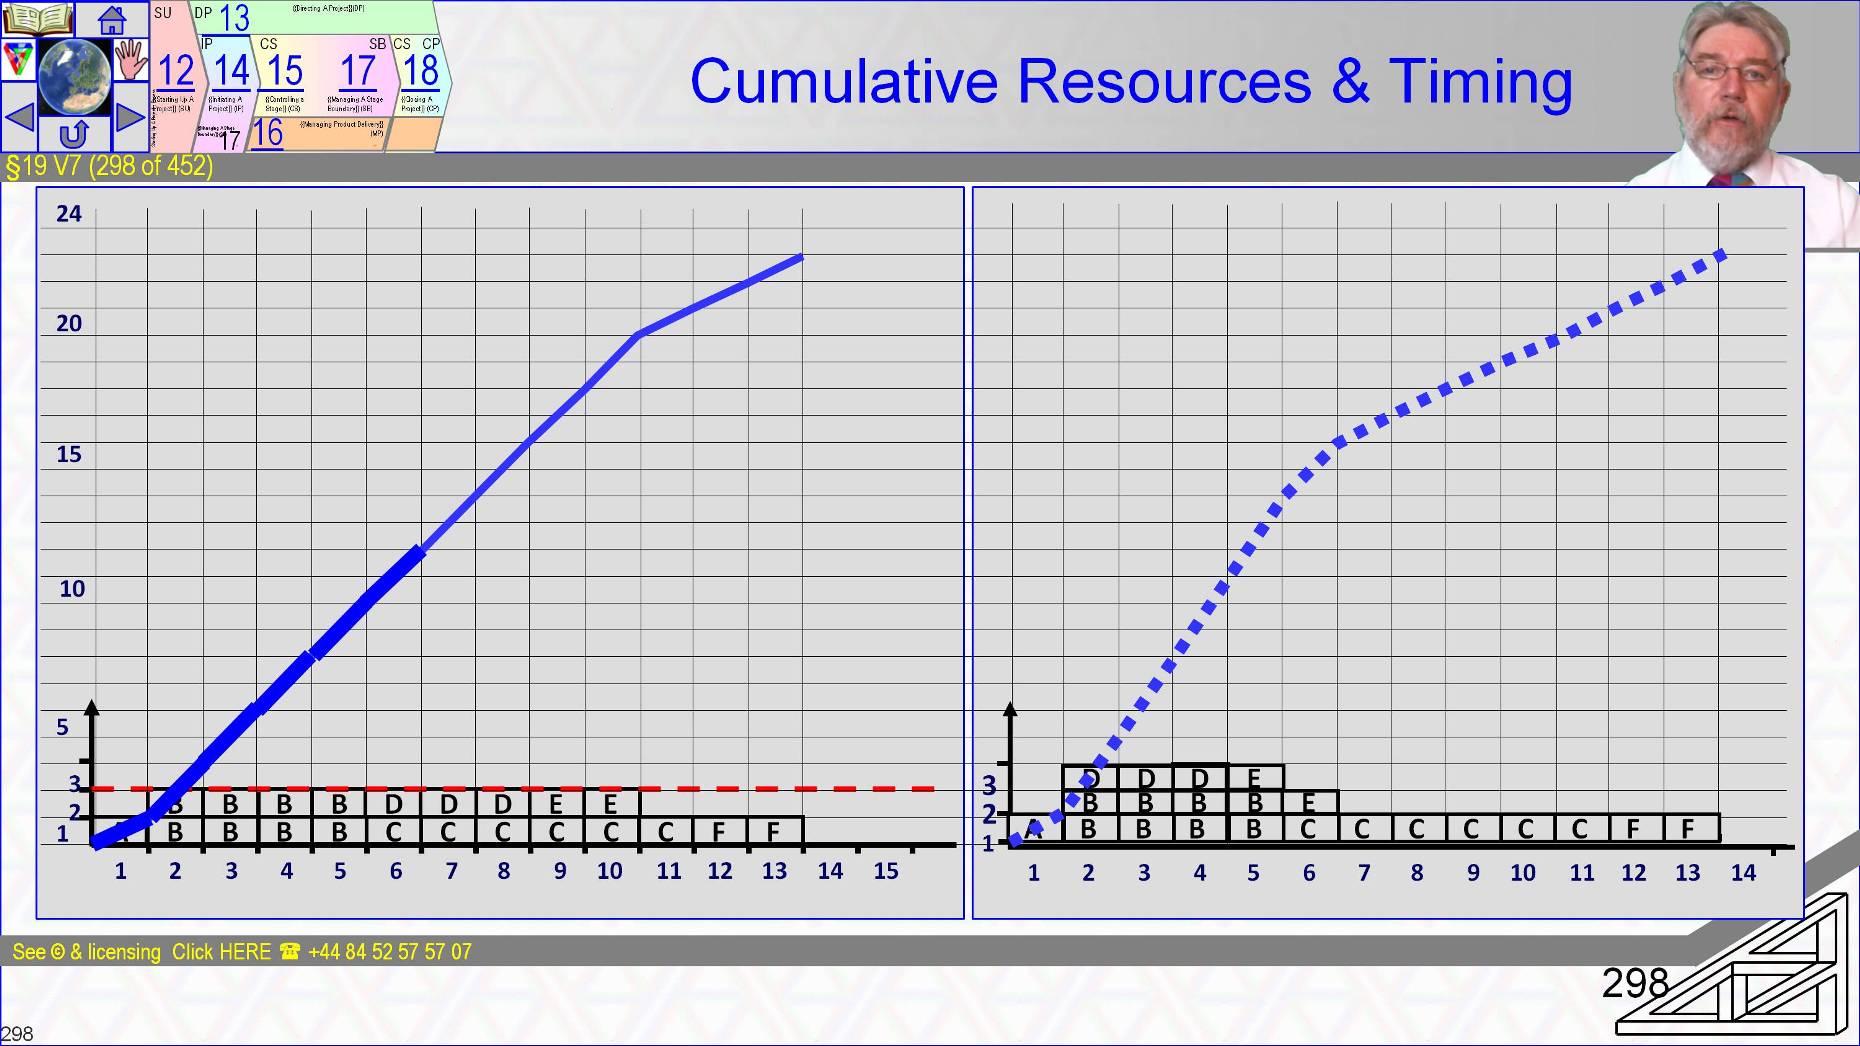
§19 V7 (297 of 454)::Cumulative Resources & Timing::
When, finally we have products defined and decomposed to technical, quality and management tasks which are scheduled and resourced and levelled timelines, the cumulative budget needed by the Business Case for discounted cash flows can be determined and net present value and other investment appraisals applied.
- That is a very ‘traditional project view point, I could relabel it a Burn-Up Chart.
- If I redraw the diagram as “Work to be done at an ideal velocity” and track achievement then I have created a Burndown chart
- There are now truly new ideas in project planning and tracking just re-labelling.
The aspect that truly changes is mind-set. After you are p2 qualified you might like to explore the mindset-change by consulting our prince2-Agile guidance
- See learn.logicalmodel.net
~~
[[ToDo: new]]
§19 s298 = WBS + Resources & Dependencies = Schedule & Cumulative Cost & BAC
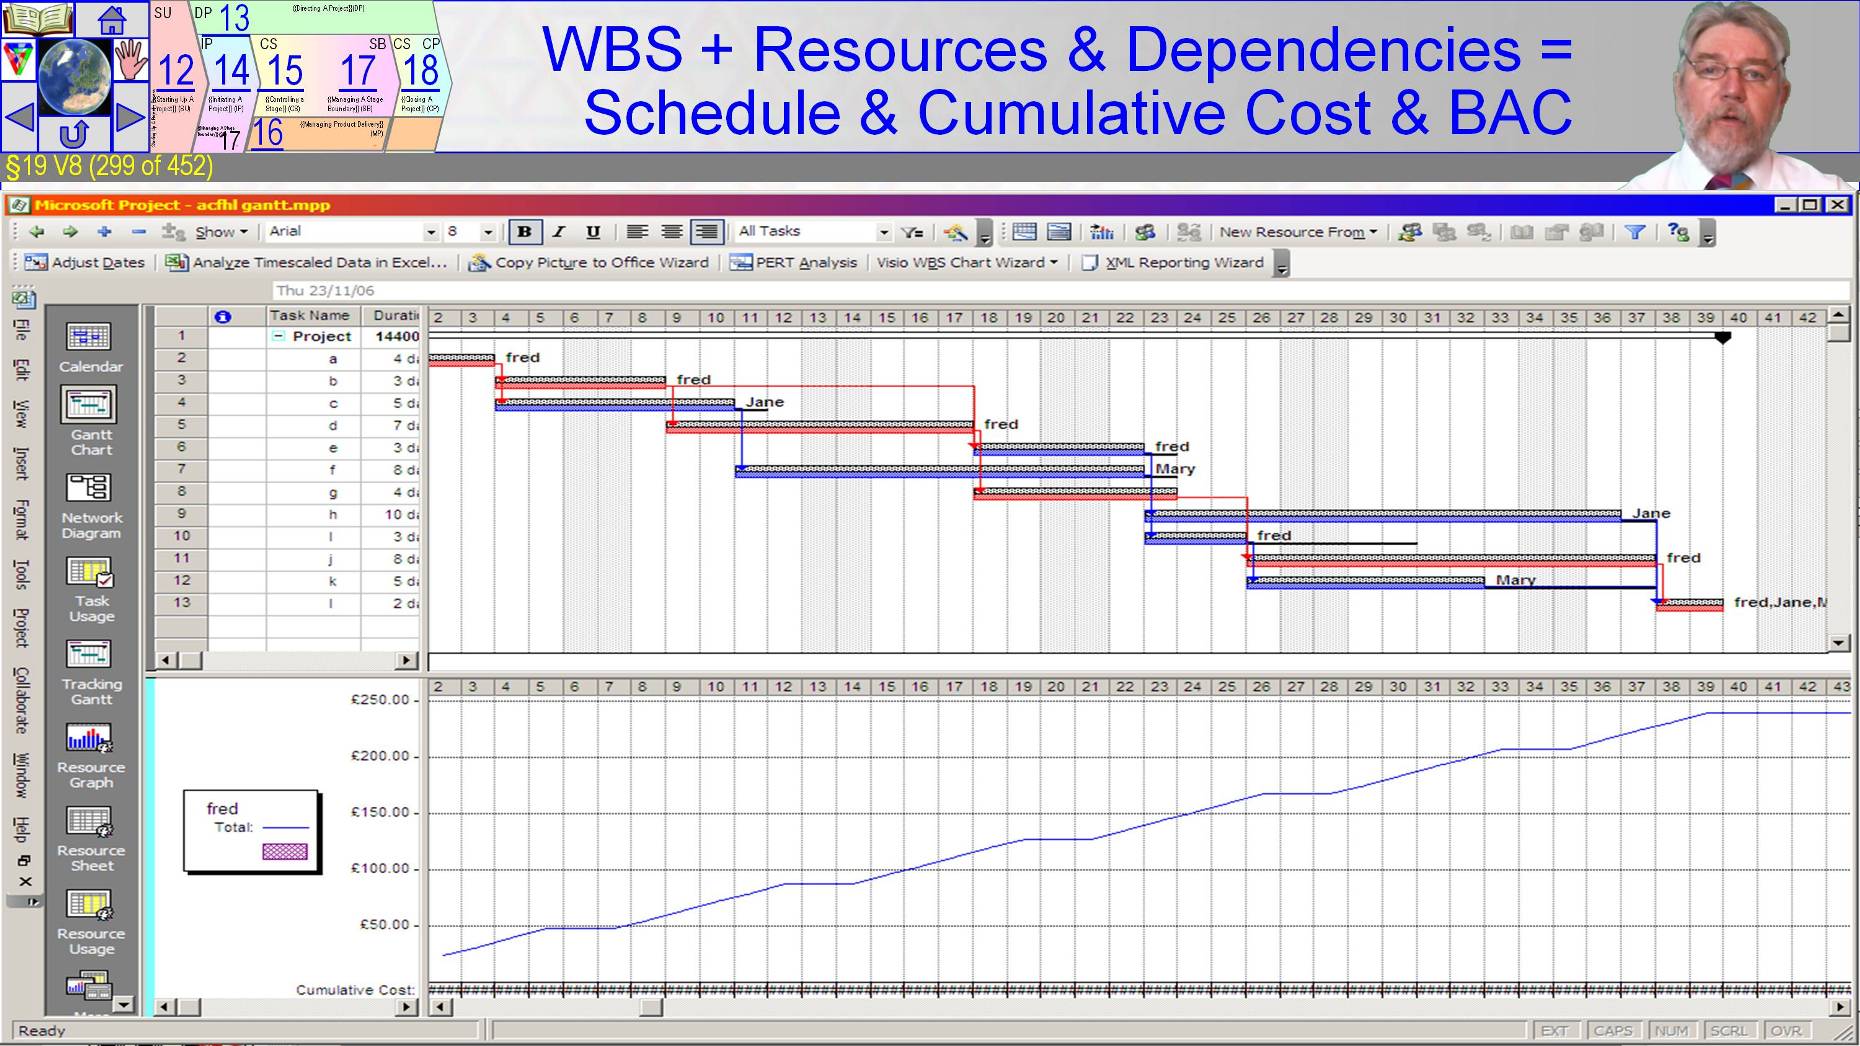
§19 V8 (298 of 454)::WBS + Resources & Dependencies = Schedule & Cumulative Cost & BAC::
Again this is graphic shows standard industrial strength project management tool usage.
It is outside the scope of PRINCE2’s exams but when you need to do the job of Project Manager with the standard toolset then visit the Logical Model website for the full details.
~~
§19 s299 = Scoping Workshops
§19 V9 (299 of 454)::Scoping Workshops::
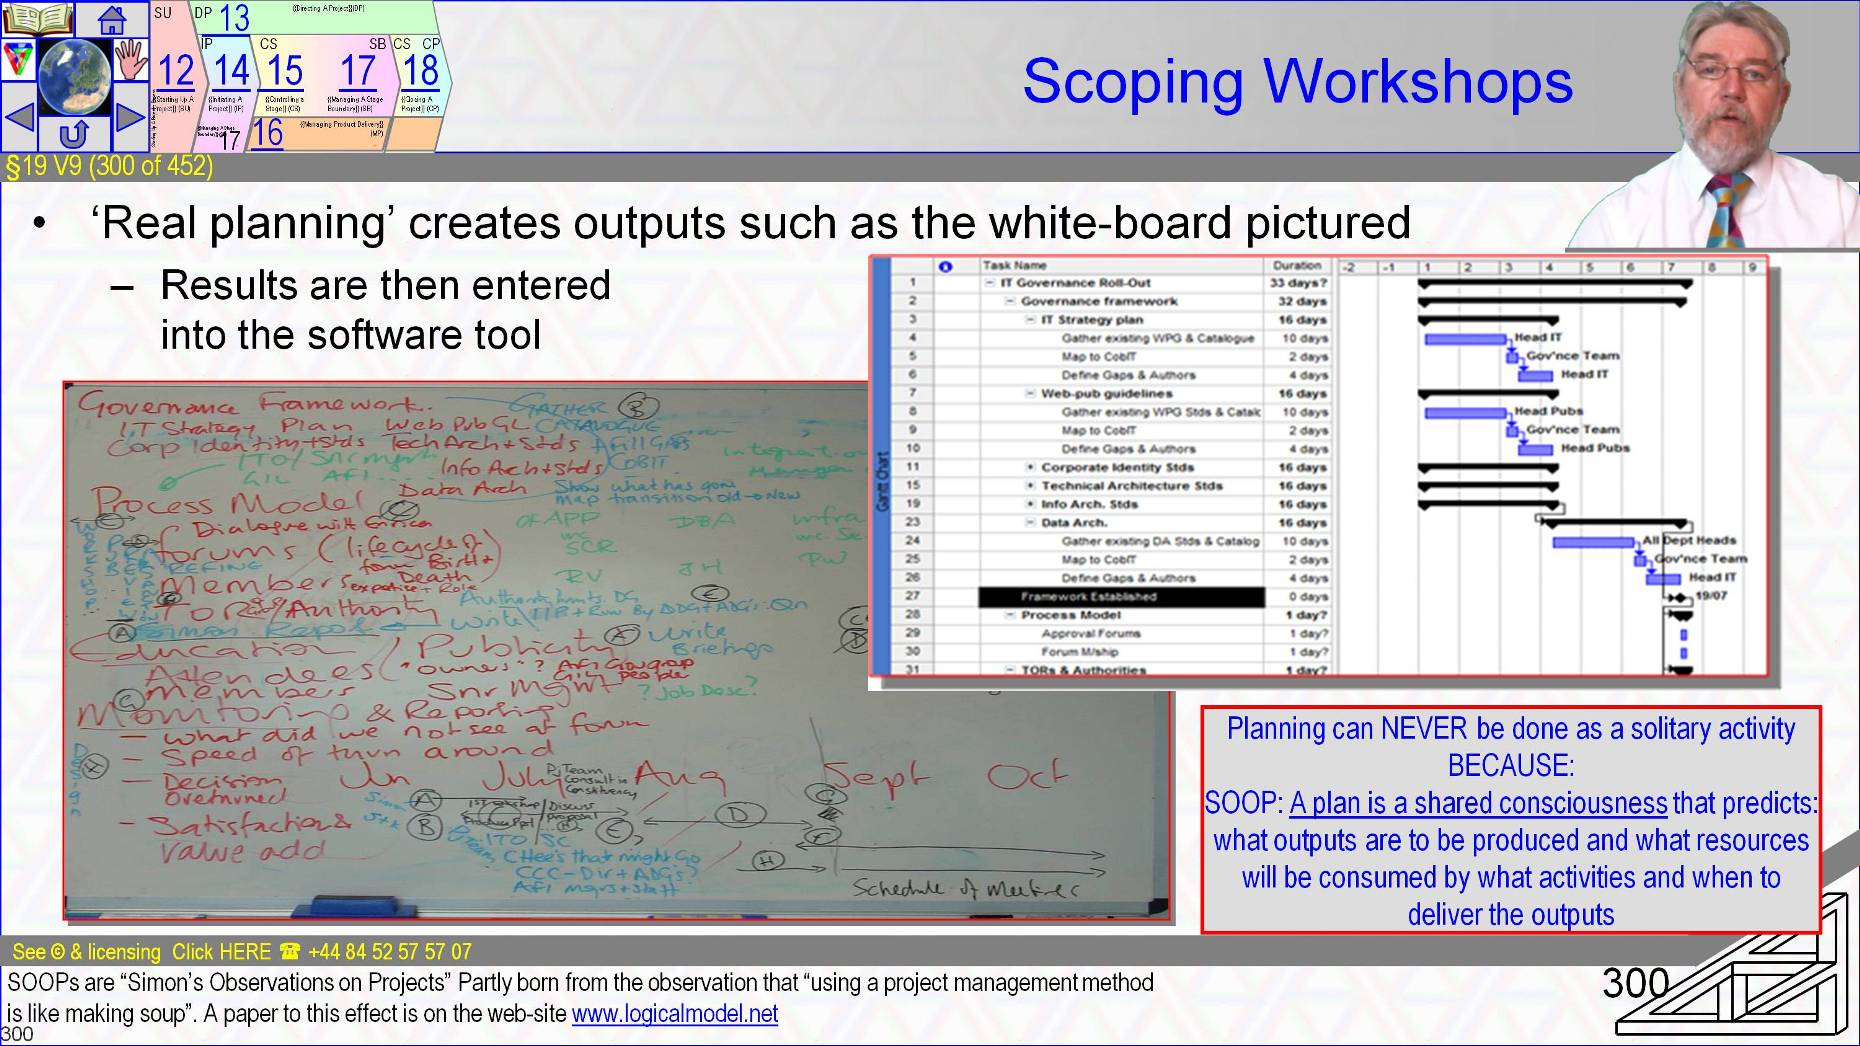
The reality remember is that scope is determined in workshops.
- Here the Project Executive and the Senior User’s needs are written in red.
- In blue the tasks to deliver the results, somewhat harder to pick out are the names of the resources, here’s mine, and then tasks are mapped to a crude timeline that acknowledges European dead time over August.
- The transcription to software is just documentation.
The planning finished when the caps were replaced on the white board markers.
~~
[[ToDo: unch]]
§19 s300 = Waterfall (Design First) Actually a ‘V’ Model
VnCtl:29/08/2016 21:42:06 This file is part of Logical Model Ltd’s p2FdtnAndPrctnt training course