7. Throughput: How fast are we going?


This chapter focuses on throughput, the number of work items that were completed during a time period.
7.1 Why should I care about throughput?
As a team member: throughput helps you become more predictable, so you are able to make more realistic commitments. You have data to fight the pressure to fit more work into the available time and thus avoid death-march projects (DeathMarch).
Using throughput you also spend less time estimating, which leaves more time for other work. Meetings should get faster as decisions become less based on personal opinions and more on data.
As a Scrum master or coach: throughput helps you check if the team is improving and validating the effectiveness of experiments. Facilitating planning meetings and estimation sessions becomes much easier as you focus on the content of the stories rather their size.
As a product owner: throughput gives you realistic expectations of what the team can and can’t achieve. You start thinking in terms of “What are the chances that we can fit this story in the next couple of weeks?” rather than relying on the team promising that “they’ll try”.
As a manager: throughput helps teams make realistic promises so you’ll know when they’re likely to start/finish work. You’ll have data to play what-if scenarios.
As a customer: throughput gives the team the ability to make you realistic promises. Disappointments become the exception rather than the norm. You can be confident that when the team says they’ll get something done, they probably will.
7.2 What’s the problem with velocity and story points?
This chapter is all about answering questions like “How fast are we going?” or “How much work can we complete?”. Typically Agile teams use story points and velocity to come up with an answer.
Story points are a measure of the perceived size of a user story. For example ‘Copyright on webpage footer’ might be considered small and thus allocated a single story point, whereas ‘Enforce password strength policy’ might be considered large and so be given ten story points.
Teams then apply their velocity - that is the number of story points per sprint the team can deliver - to decide how many stories they can include in the next sprint. They might also use velocity to determine how many sprints it will take to complete a given set of user stories (Cohn2016 Cohn2014).
These practices are so common amongst Agile teams that they are considered the norm. However, it’s not all roses: let’s look at some of the problems with this approach.
The problem: low correlation with lead time
When Mattia first joined his team in late 2013, they were playing planning poker (PlanningPoker) and estimating using story points. The team was used to it and had been doing that for a long time. Mattia wondered if their estimates were making sense and if they were at all predictable, so the team started to gather some data. Little did they know that they were in for a big surprise…
The chart below shows the results found by Mattia and his team. In particular, for each story, we can see the relationship between estimated story points and how long it actually took to complete the story (in other words, the story’s lead time).
Mattia and his team were absolutely shocked to discover that 1-point stories were taking between two and ten days, 2-point stories were taking between two and twenty days, and 3-point stories were taking between six and eighteen days! There was very low correlation between their estimated story points and the actual lead time.
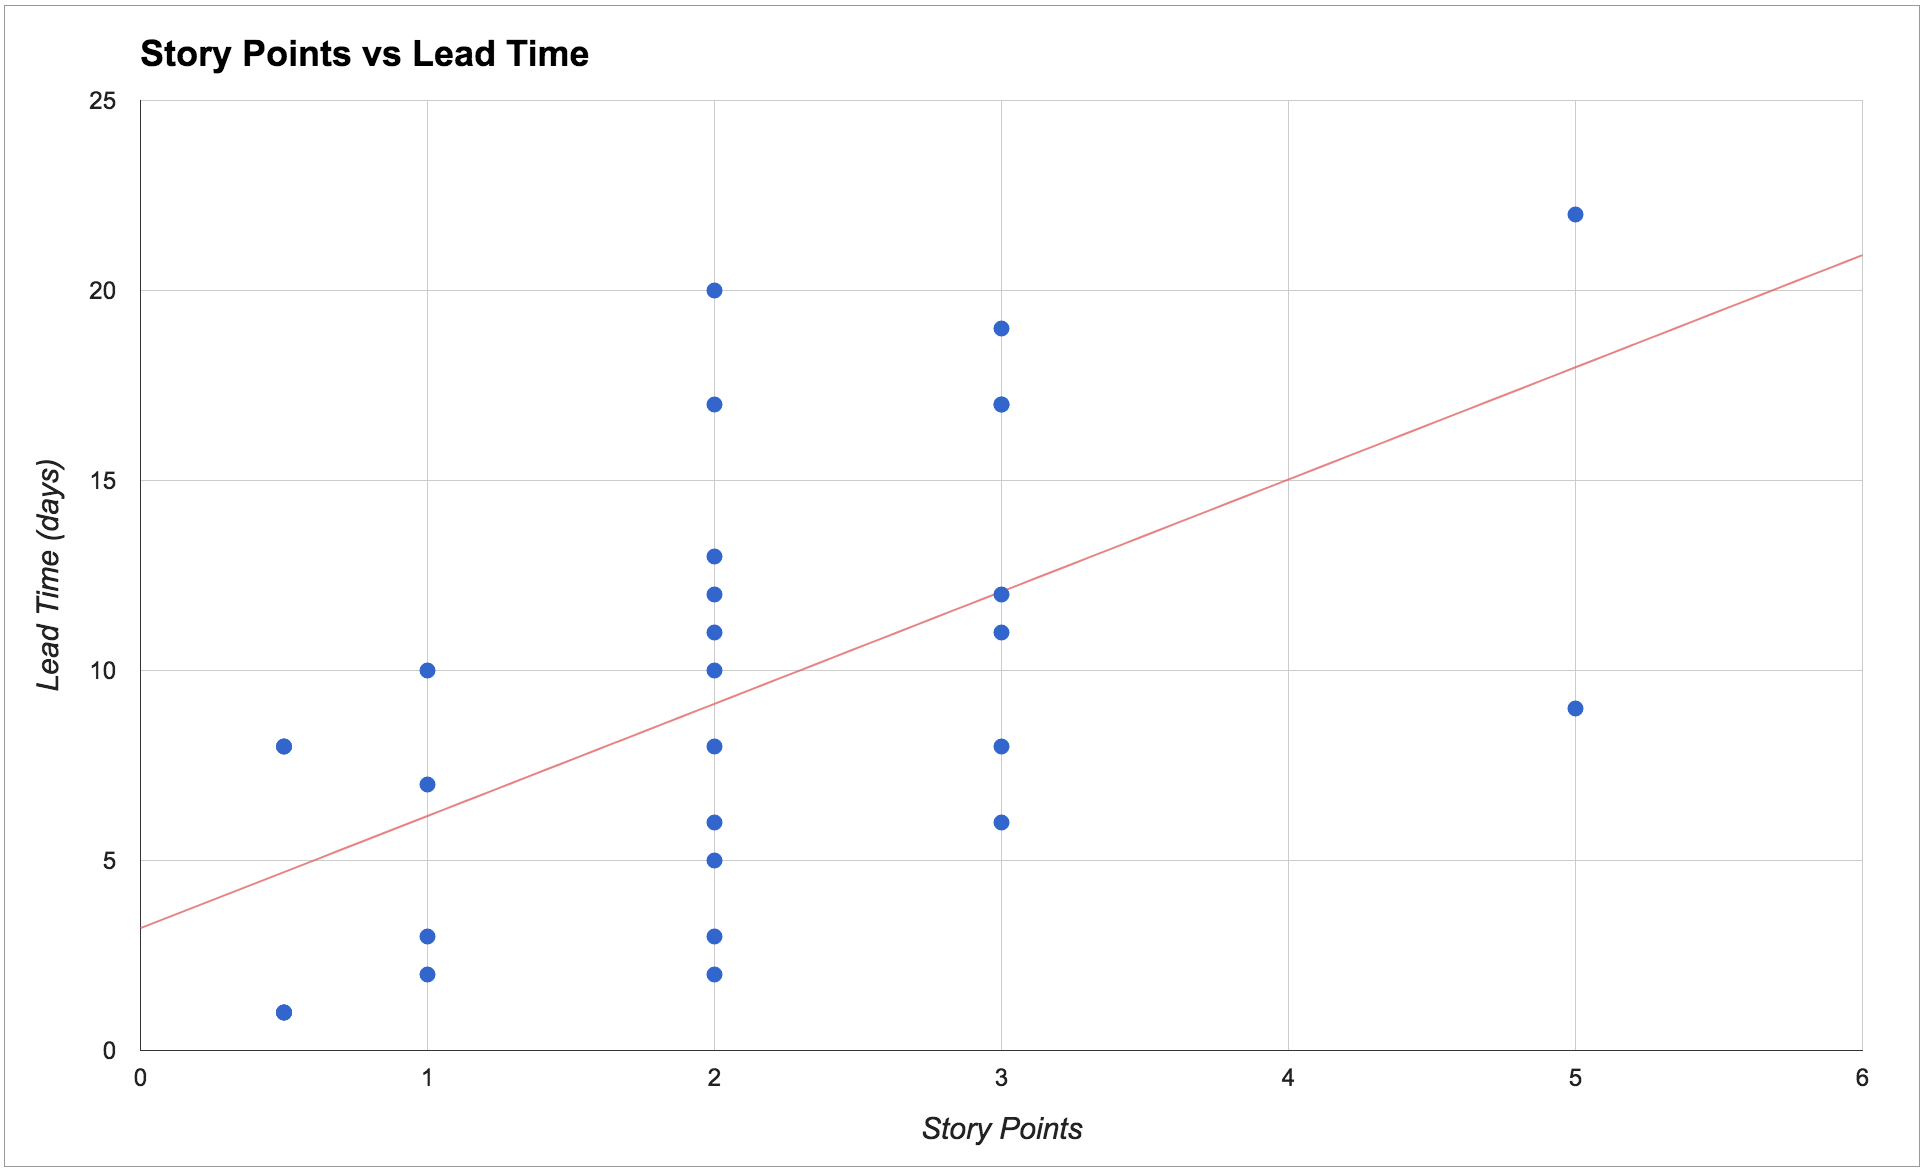
Such low correlation meant the estimates were adding very little value: the team really had no meaningful way of predicting how long a story would take based on its estimated points. Consequently, their velocity made little sense and the team was highly unpredictable.
The team therefore decided that it wasn’t worth it to continue investing time estimating using story points anymore. Instead, they started to base predictions on historical data and the metrics described in this book.
In particular, throughput proved to be the metric that could answer their questions in a way that was easier, cheaper and more accurate.
What causes these problems?
There are three important factors that have a much higher impact on lead time than user story size, and that when left unmanaged make our teams throughput unpredictable.
First, do we have a high amount of work in progress (WIP)? When we work on too many things at the same time we are not able to focus on finishing the tasks that are already in progress. We waste time in context switching, the quality of our work decreases, and even stories that appear to be simple end up taking longer than expected.
Second, are the queues in our process visible? How long does work sit in those queues? Very often in our processes there is some waiting time between one activity and another. For example: waiting for a developer to be free to start a story, waiting for someone to be free to test a story, waiting for the next release, etc. These queues are often invisible, they’re not represented on our boards, and it’s really common to ignore them when we estimate. When these queues are not managed they lead to a lot of work in progress but on hold, which in turns lead to high unpredictability.
Third, are unexpected events common? Events like being blocked by a broken test environment, having to clarify requirements, or ‘urgent’ problems such as a defect in production, make us interrupt and put on hold activities that have already been started.
When we have one or more of these problems - and most teams we’ve worked with certainly seem to - then the estimated story size doesn’t matter as much as it has a very low correlation with the actual time taken to complete the work.
Even the simplest story is going to take ages if we’re not focused, if we waste time in numerous hand-offs, or if it’s constantly overtaken by more urgent activities. For more details on solving these problems see the chapter on Forecasting and planning.
Are story points bad?
The use of story points, or rather the non-use of them, has been a controversial topic in the Agile community. So let us be clear: by no means are we trying to discredit story points in this book. For many teams and companies they have represented a tremendous step forward from the past, and they’re still using them successfully.
What we are saying is that if you recognize some of the problems described above, then chances are that story points are not giving you much predictability.
Several people in the community have found similar results to ours:
- Vasco Duarte, one of the main proponents of #NoEstimates, found high correlation between story points and number of completed stories, suggesting that they’re measuring the same thing (Duarte2012).
- Larry Maccherone analyzed data from 1000s of teams and found that throughput was the best measure for productivity and predictability (Maccherone2014).
- Ian Carroll found low correlation between story points and lead time for 25 teams (Carroll2016).
- Folks at ThoughtWorks found that they were getting the same predictability using story count (throughput) or story points (ThoughtWorks2013).
- Nader Talai presented very similar results, where throughput gave his team the same predictability as story points (Talai2014).
- Pawel Brodzinski, a bit provocatively, created a new set of planning poker cards where the only values are “1”, “Too Big”, “No Clue”. For him the only interesting question is whether the story is small enough, without needing to estimate whether it’s a 5 or an 8 points story (Brodzinski2015a).
Should I stop using story points and velocity?
By all means, if you’re finding story points and velocity useful in your team please keep using them! What we invite you to do however is to ask yourself and your team: “Are our estimates really working?”.
Whatever estimation process you use at the moment - story points, t-shirt size (Singh2016), ideal days (Rao2014), or others - generate a chart like the one above. Is there a correlation between your estimates and the time taken to complete your stories? You might be surprised by the results.
Our advice is: don’t drop whatever estimation process you’re currently following, but start collecting data and generate some metrics. After a while you can compare your estimates and your metrics and decide what makes you more predictable. You should be able to start using your data to improve your estimates.
And if at some point you end up deciding that you want to drop story points, then having team data in your hands will make it a lot easier to convince the people around you.
7.3 What is throughput?
Throughput (often also called delivery rate, or story count) is the number of work items that were completed during a particular period of time.
Throughput is extremely simple to calculate and provides high value, that is why we think it makes for a great starting point.
How do I calculate throughput?
It’s extremely simple: just count the number of work items, such as user stories, that have been completed in a fixed period of time. The period could be a two-week sprint, a week, a month, and so on. The important thing is to keep it consistent. If you do Scrum, or work with iterations, the easiest thing is to make it coincide with the length of your sprint. Otherwise, just pick a cadence that works for you.
For example, say our team chooses a two-week period. Then every two weeks we count how many stories have been completed in that period of time.
Tips for calculating throughput
If you use a physical board: you can simply count the number of cards that have reached your “Done” column (or whatever you consider as completed, according to the policies of your process). After you’ve counted the stories you might want to clean your “Done” column, so that next time it will be easier to see what has moved there since.
If you use an electronic board: some tools let you extract this information. If yours doesn’t, you can quite easily calculate the throughput just by knowing the end date of each work item. Simply calculate what iteration/sprint that end date falls into. For an example, have a look at our public repository (https://github.com/SkeltonThatcher/bizmetrics-book) or at Troy Magennis’ collection of spreadsheets (MagennisSpreadsheets).
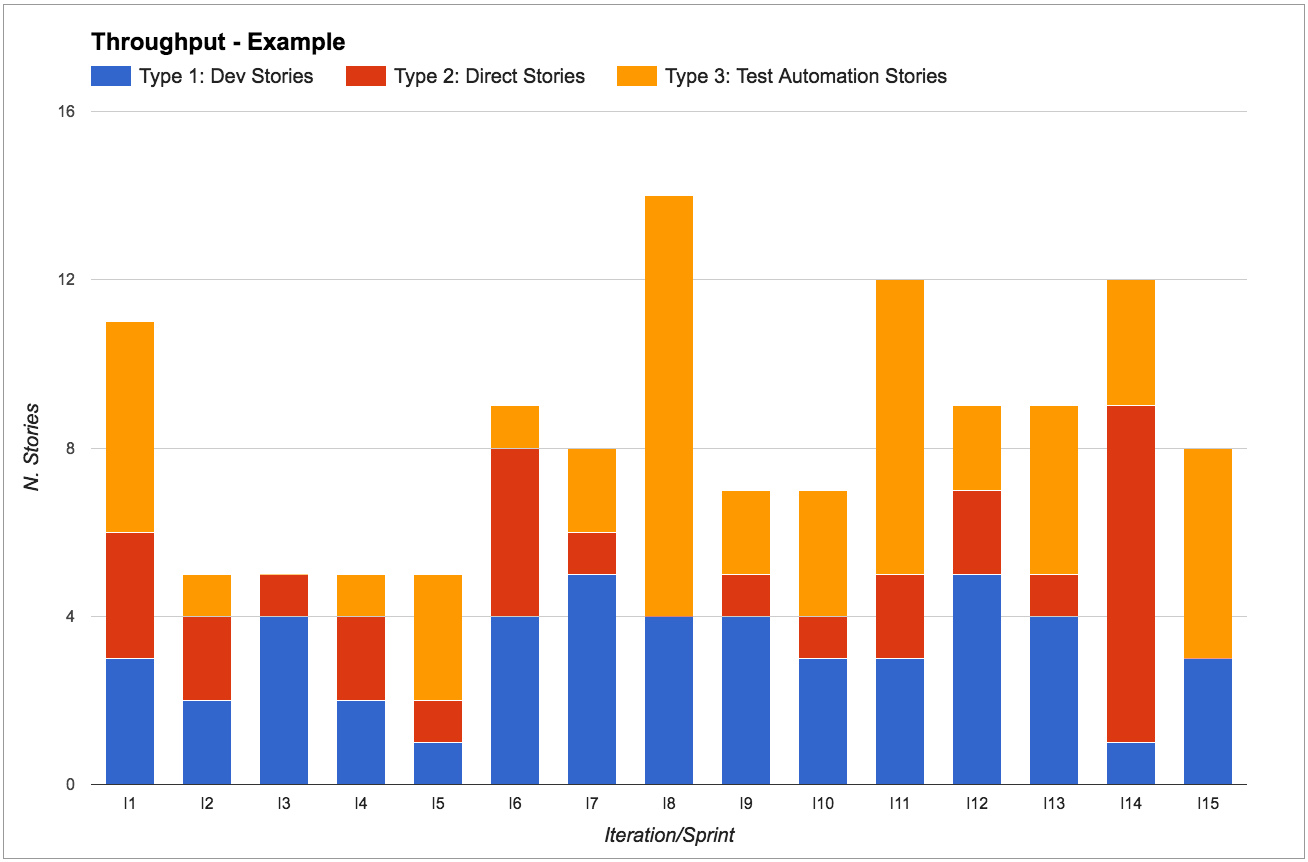
Split by work item type
We recommend splitting throughput by work item type in order to know how many of each type we usually get done in a given period. This will enable us to make much better predictions (more on this in chapter 6).
Different work item types are usually characterized by:
- Whether they follow a different process (for example, some user stories might not need to be tested, whilst some have to go through a special test environment)
- Follow the same process but at a consistently different speed (for example, work we do in our legacy codebase is consistently much slower than work on the greenfield app).
Don’t go overboard though: typically we’d expect teams to only have a handful of work item types.
In Mattia’s team they use:
- “Dev Stories” to represent “normal” work. These stories go through each step of the process before being “done” - they are analyzed, developed, tested, and then released.
- “Direct Stories” to represent work that goes straight from “development” to “done”, like writing a report, investigating a support issue, responding to a team email. These stories follow a different process as they skip the test and release steps, and therefore have a much lower lead time than “Dev Stories”.
- “Release Testing Automation” to represent work that the testers are doing to automate their manual regression tests. These stories follow the same process as “Dev Stories” but are usually much quicker.
Most metrics only make sense when analyzed for a particular work item type:
For example, say that we are working in iterations and we’re dedicating one sprint to stories on a new technology that we’re not familiar with. We don’t have historic data for these, so we’re unsure how long it will take. Our gut feeling is that it will take longer than usual, thus the throughput in this sprint will be quite different from other sprints.
It’s important to have the data to acknowledge that the throughput change was due to this new type of work. We can then decide if we should treat this sprint as an outlier or if we need to revisit our forecasts instead.
7.4 Use throughput for short term predictions
“How many stories can we complete in the next sprint?”
“How much can we get done in the next two weeks?”
These are common questions most teams get asked during sprint planning (in Scrum), queue replenishment (in Kanban), or simply when talking to stakeholders.
The good news is that the team can answer them by looking at their throughput stats.
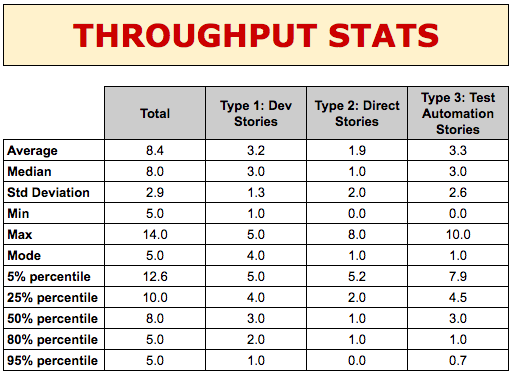
These stats are telling us a lot of useful information:
- Average (mean) and median: how many stories do we complete during a sprint, typically?
(by the way, we usually prefer to look at the median rather than the mean average as it’s less impacted by outliers, so it’s usually a more accurate representation of reality)
- Standard deviation: how much variability in throughput have we got?
(we usually look at its trend to see if variability is increasing/decreasing. The actual value is not important as it’s only reliable when our data follows a Gaussian distribution, which is rarely the case in a software development process (Zheglov2014a))
- Min and max: number of stories ever completed.
- Mode: what’s the most common throughput?
(this is the number that occurs most often, so it’s the one that people usually remember off the top of their head)
- Probability percentiles: what’s the likelihood of completing that many stories in one sprint?
Let’s focus on stories of type 1 for a second (“Dev stories” in our example) and look at their percentiles. The 80th percentile tells us that in 80% of sprints we complete at least two “Dev Stories”. Similarly, looking at the 50th and 25th percentiles we know that in 50% of sprints we complete 3 stories, and only in 25% of sprints we complete 4 stories. Therefore if we want to have a high level of confidence that the “Dev Stories” we start working on will be completed within two weeks, we should only pull in the next 2-3 “Dev stories”.
We could risk it and pull in a fourth one, but the chances of getting it done are very slim - 25% chance, to be precise - so we wouldn’t want to make any promises to our stakeholders about that fourth story!
If we now look at type 2 (“Direct Stories”), we know that in 80% of sprints we also complete one “Direct Story” on top of the other “Dev Stories”. So we can also safely pull in one of these stories. Similarly, we can confidently expect to complete one or two “Test Automation Stories”.
In short, for each story type, we look at the throughput of that type of work in order to make predictions about how many stories we can complete in the next period.
Notice how this approach makes planning sessions a lot faster: since we know that we rarely complete more than four stories, there’s no point talking about stories that we won’t even look at.
Queue replenishment: “How often should we decide what to work on?”
In our experience working with Scrum teams, a common struggle we see is planning for the next two weeks.
Regardless of the decisions taken during sprint planning, the team’s plans often get trumped by new urgent stories, emergencies, and stakeholders changing their mind.
The team feels that they’re not reactive to change, and that they should be more flexible changing scope or priorities. That’s a symptom that their batch size of two weeks is too large for them, and they should instead plan shorter periods of time. And so they find themselves asking questions like “How often should we do planning? How many stories should we have in our ‘Next’ column?”.
Don Reinertsen (Reinertsen2009) teaches us that reducing batch size is almost always a good idea, but where is the sweet spot? The more often we plan the more flexible we can be, but we also don’t want to spend all our time planning, and the people we need to make those decisions might not always be available. Luckily, we can use our throughput to decide how often we should replenish our queue.
Let’s have an example: say that our team would like to plan every week instead of every two weeks, meaning that every week we have a chance of reviewing priorities and changing direction. How many stories should we put in our ‘Next’ column? Well, let’s use our throughput stats: in a week we usually complete three to four stories. So let’s have four stories in our ‘Next’ column, and every week we will replenish it.
At Honeycomb TV the throughput of the technology team, which uses Kanban, is such that a queue of four items empties out once a week. Hence every Tuesday a Google Hangout takes place where the technology team and its customers, the wider business, gather around the Trello board and decide what to put into the queue next.
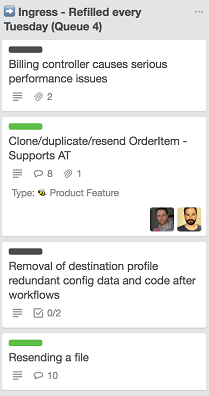
In the screenshot above there are two pieces of value work - that is features (green label) - and two pieces of operational overhead (black label).
When deciding how often to replenish the queue, you need to take into consideration the product owner’s availability. If the product owner is needed for planning but is only available every three days that means that we can’t possibly replenish more frequently than every three days. We’ll size our queue based on how many stories we usually complete in three days.
Queue replenishment: “Are we reducing technical debt?”
We can use throughput to analyze the percentage of effort we spend on work items of each type. A typical usage would be to make sure that we are working on technical debt items: we can agree as a team on a percentage of capacity to reserve for technical debt, and honor it at queue replenishment.
For example, Chris’s team realized that they were spending too much effort fixing defects, taking away time from other value-adding activities. Recently they had been focusing too much on adding new features and weren’t doing enough to keep technical debt under control, resulting in a high number of issues.
They decided on a a new team policy: whenever they were pulling in new work, for every three business stories they would pull in a technical story.
Using this policy made sure that the team wasn’t pressured into working only on business work and that technical debt was being addressed.
Visualizing predictions with rolling wave forecasting
A nice way to visualize our predictions is by using a technique called “rolling wave forecasting”, introduced by Vasco Duarte in his book “No Estimates” (Duarte2015).
We visualize the stories in our backlog using different colors. Each story gets a different color based on how confident we are that they will be completed in the next two weeks:
- green = definitely
- yellow = probably
- orange = possibly
- red = unlikely
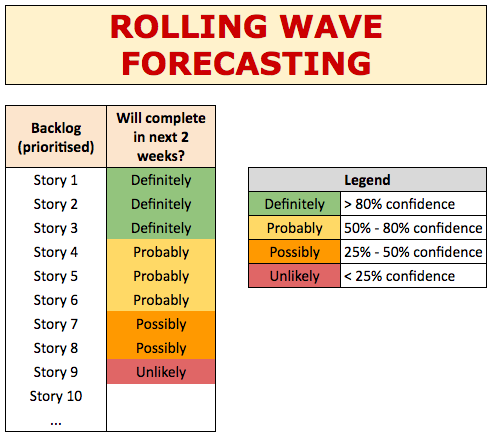
These levels of confidence are taken from our data, using the percentiles from our throughput. If the 80th percentile is three stories, then we’re 80% confident that the first three stories in the backlog will be completed in the next two weeks (green). We’re 50% confident that we’ll complete up to six stories, so stories four to six are yellow. And so on for orange and red.
7.5 Use throughput to validate experiments
“Are we improving?”
“Are we going faster/slower?”
One of the Kanban practices says “evolve experimentally” (AndersonCarmichael2016). Metrics are a fantastic tool to help us do that: we drive our continuous improvement through running experiments, and metrics help us decide whether those experiments are successful or not. Whenever we introduce a change, for example implementing an action from a retrospective, we rely on our metrics to know if the change is helping us improve.
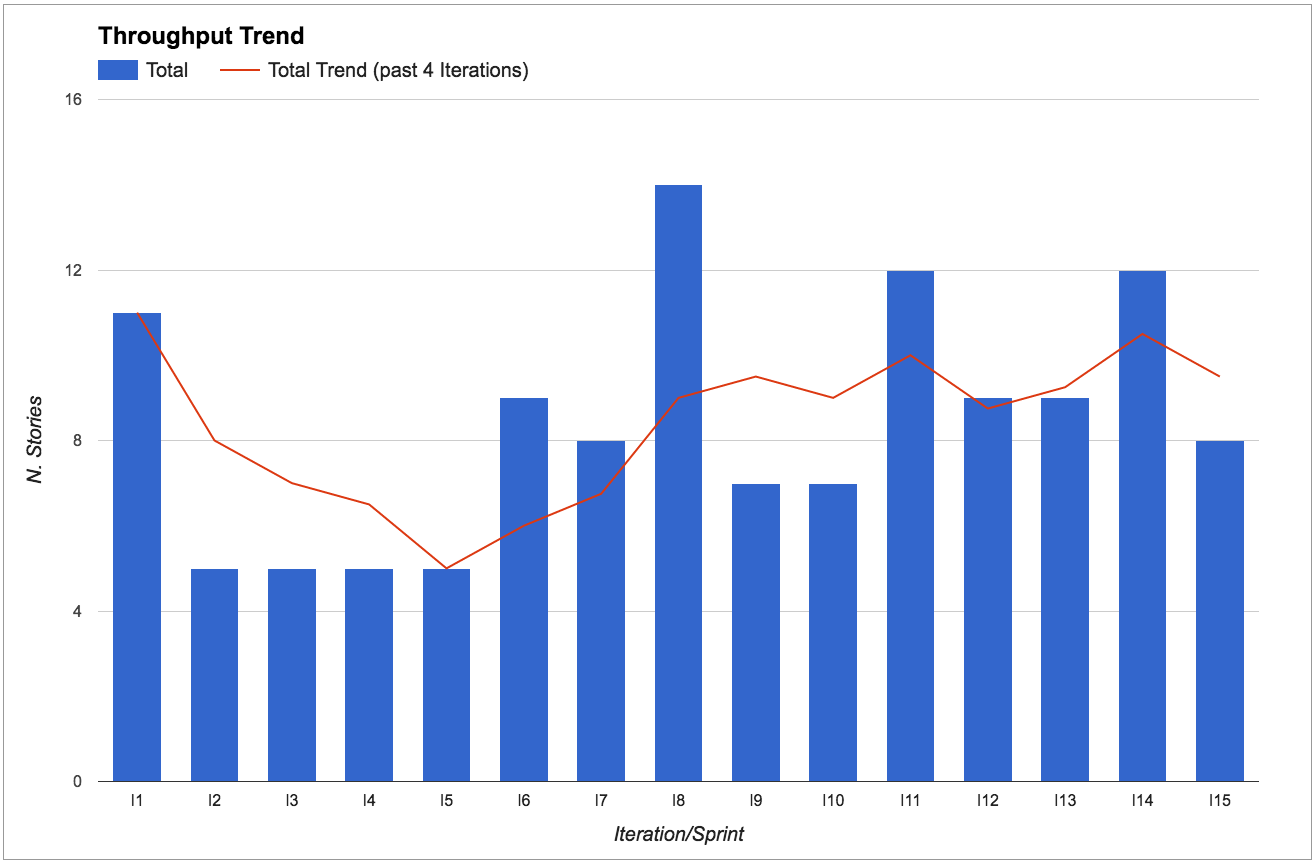
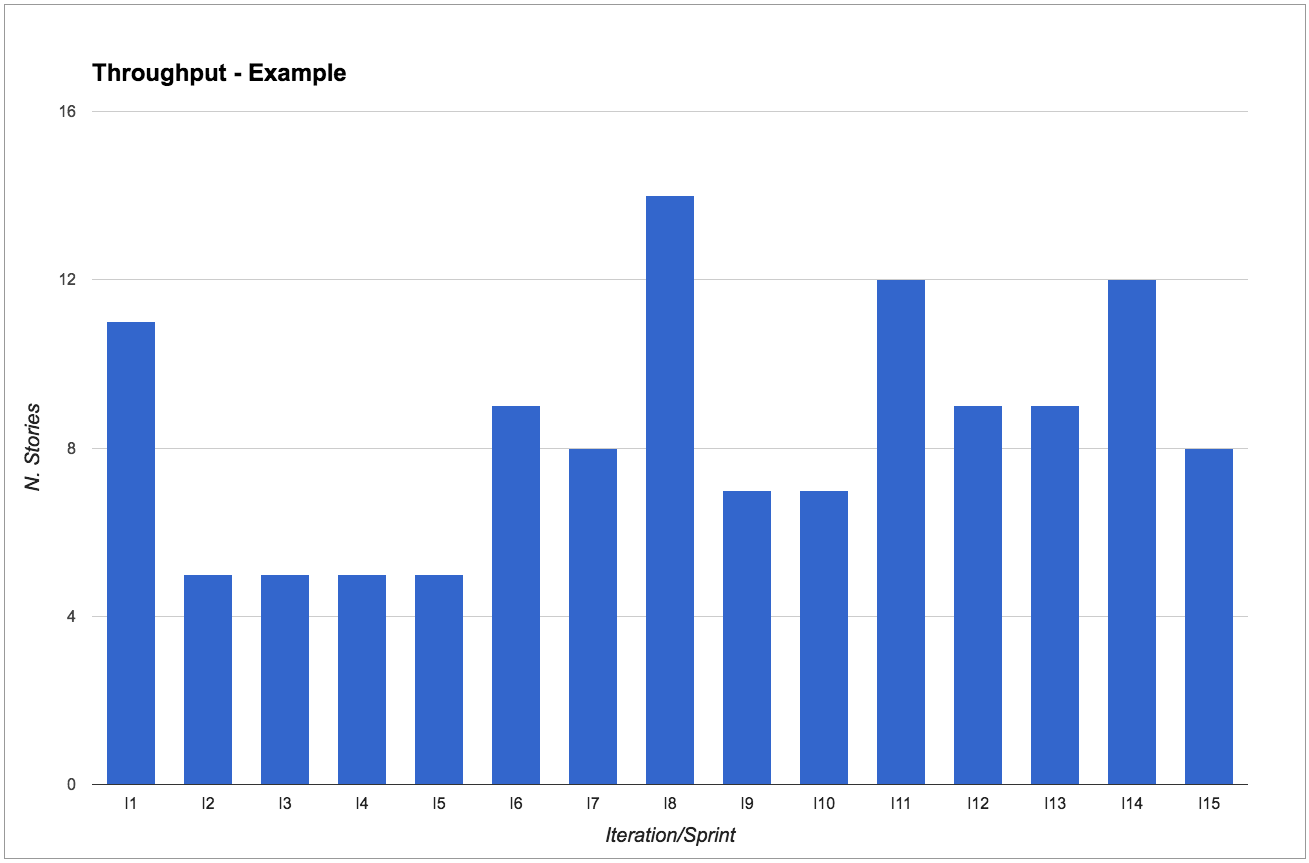
Throughput is great to know if we’re going faster or slower. In particular, we look at the throughput trend by calculating the throughput average over the past four iterations.
We look at the throughput trend rather than absolute values because continuous improvement is about going in the right direction, rather than hitting a particular target. So as long as the trend is going up, we’re improving.
What would an experiment look like?
The key part of an experiment is treating our ideas as hypotheses and setting our expectations before we start: what do we expect to happen after we introduce this change? How and when are we going to know if this experiment has been successful or not?
For example, say that during a retrospective we come up with the idea that we should do more pairing between developers and testers because we think it will reduce the amount of rework due to bugs. Rather than just saying “let’s do more pairing” we can formulate it as an experiment that might look like this:
Current situation: Several stories need rework due to bugs found during exploratory testing. Average of 0.5 bugs per story.
Our hypothesis: We believe that if developers and testers paired more, developers would learn how to prevent those bugs, resulting in less rework, and therefore having more time to complete other valuable work.
Action: For the next four sprints, each developer will spend at least one day a week pairing with a tester.
Expected results: Initial slow down in the first sprint due to time invested in learning about testing strategies, then in the last sprints we expect less bugs and less rework, therefore more stories completed.
How to measure our results: In the first sprint we expect throughput to go down of 1 or 2 stories. But in the following sprints we expect less bugs and higher throughput (extra 1-2 stories) compared to now.
Notice that we’re not just checking that the number of bugs goes down, as that could be achieved by simply spending more time on a story. As well as less bugs, we want the throughput to increase to make sure that we’re actually improving.
This is just an example structure for your experiments. There are many techniques that can help here, like A3 thinking (A3Thinking) or the Toyota Kata (Rother2009 Forss2016).
Your experiments don’t have to be as formal as this, but make sure to talk about what you expect before changing something, and then use your metrics to determine success, in particular analyze your throughput changes.
How do I know if my experiment passed/failed for the right reasons?
In our experiments we do our best to change only one variable at a time, to try and find a cause-effect relationship between our change and the results. Nevertheless, it’s impossible to fully isolate an experiment. Real life is complex (as in Cynefin-complex (Cynefin)) and every day there are many things that influence the outcome of our work. So how do we know if an experiment was really successful, and that achieving the expected results was not just a matter of chance?
The best advice we can give is: use multiple metrics. Never rely on a single metric for checking your results, as a single metric is easily influenced by many other factors than your experiment, including people trying to cheat or ‘game the system’.
For example, a common mistake is to set a particular velocity as a target. This very often results in the team estimating each story with a few extra points - what used to be a five is now an eight, threes are now fives, and so on. By focusing on one metric (velocity) the team is unintentionally encouraged to optimize their behavior to reach that target, at the cost of cheating.
Instead, if you look at multiple metrics and observe that most of them have progressed, then it’s much more likely that the experiment was the cause. Only when multiple related metrics are progressing are we really improving.
How much variation is normal?
Our teams are made of human beings working in complex environments, so some variation is perfectly normal. Actually, we’d be worried by a complete absence of variation: we’d interpret that as inflexibility and a lack of innovation.
But just how much variation is normal? Only you and your team can know. You’re the only ones that know your context and can decide if something is a one-off outlier, rather than the symptom of a problem.
For instance, the “Throughput Trend” figure above shows that from iteration I6 onwards the throughput is oscillating around 8 stories per sprint. However, throughput for iteration I8 was considerably higher (14 stories). The team knew this was an outlier because they had received extra help from other teams. Variation is fine as long as you know what caused it.
Having said that, beware of tampering (Burrows2014): if you react to events too quickly you might be reacting to what is just normal variability, and end up making your system unstable.
Real-life examples
Increase WIP limit to prove that it’s a bad idea
We recently had two new members join the team that Mattia works with. That made us six developers. We always pair program, so that makes three pairs. When they joined the WIP (work in progress) limit in development was set to two, and we purposely left it at two to encourage swarming - we love multiple pairs to work on the same story to get it done faster, whilst also increasing knowledge sharing and removing dependencies from individuals.
The new developers however didn’t seem to like this heavily-collaborative style and wanted to increase the WIP limit to three, so that they’d be “free” to work on a separate story. We thought this would be a mistake, but realized that unless we let them experience the impact of the change they wouldn’t fully understand the power of a low WIP limit.
So we agreed on increasing the WIP, and guess what? Our throughput went down. We were delivering less stories. Not only that: the lead time went up. Having learnt an important lesson, the new developers were now convinced and we went back to a WIP limit of two.
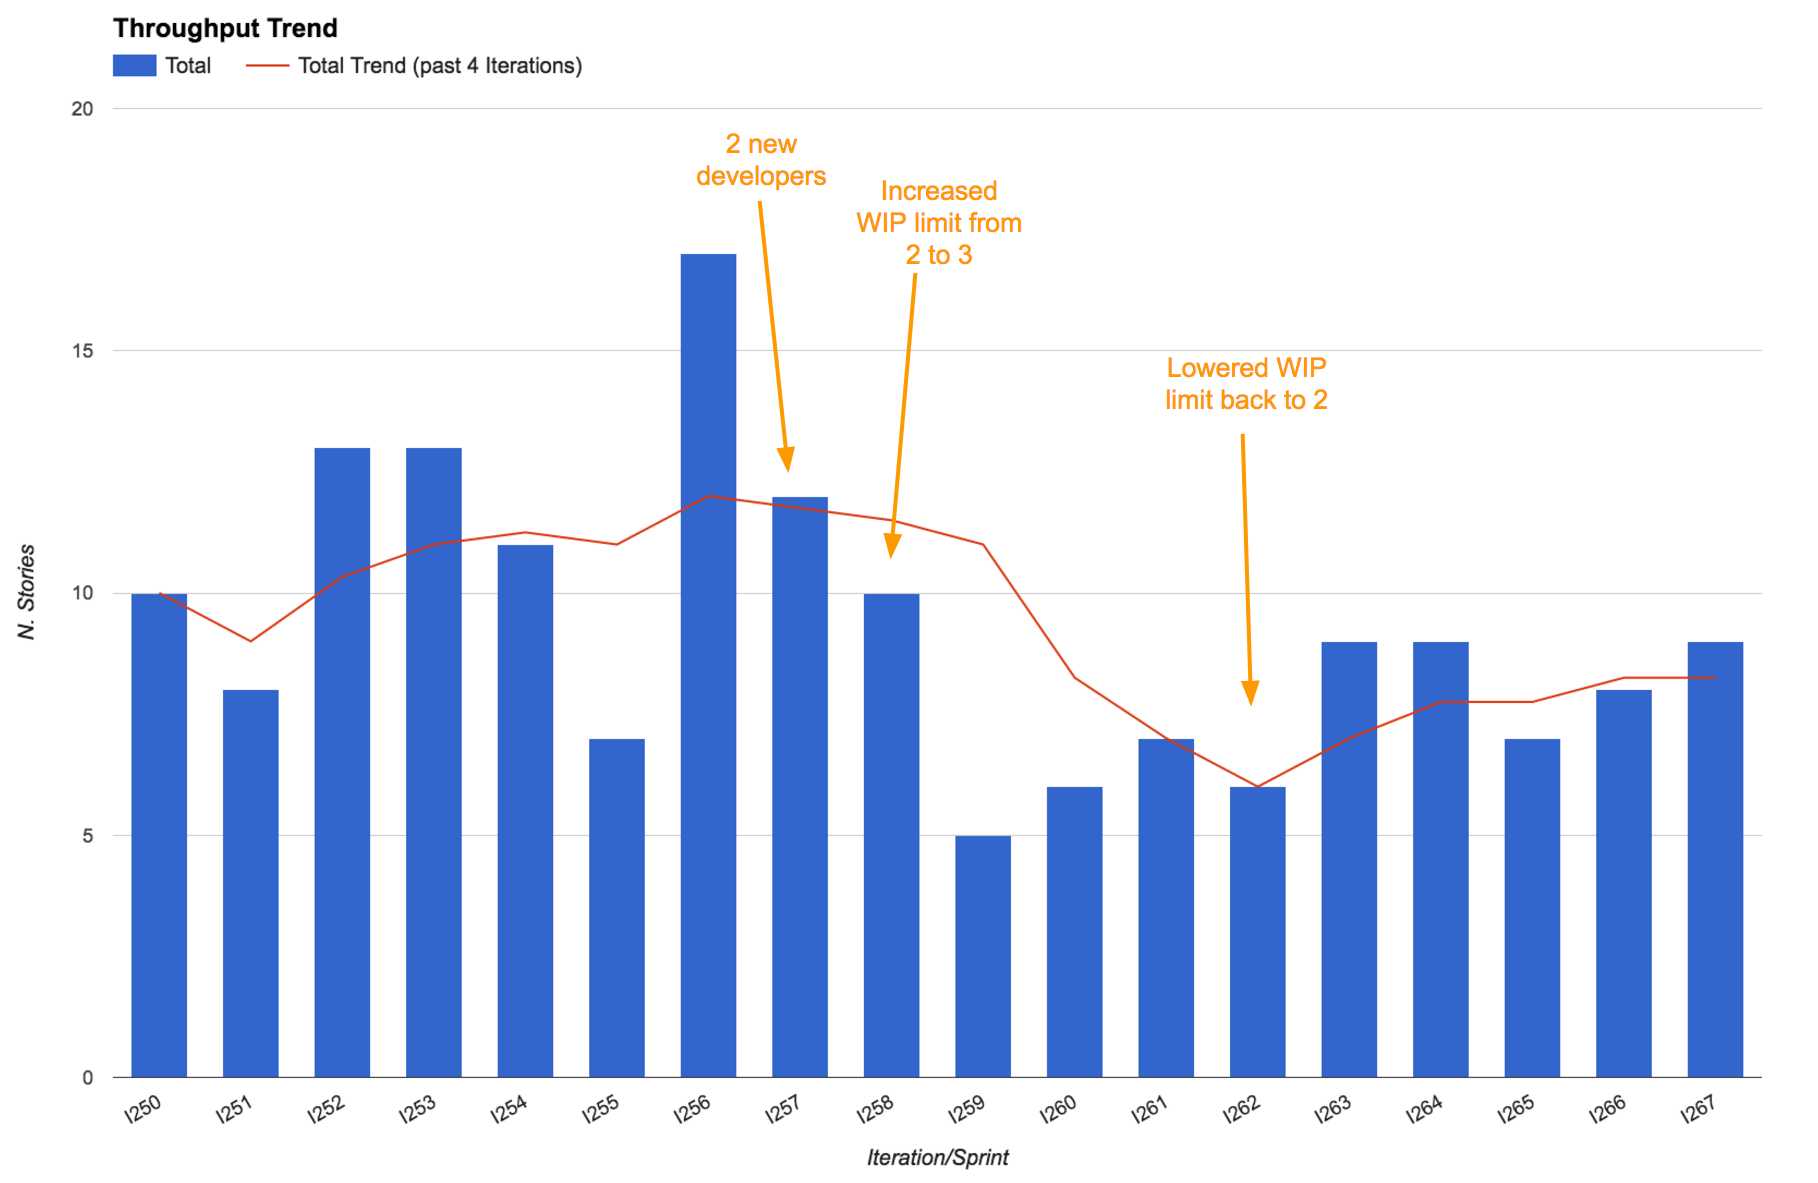
It’s interesting to notice that even after setting the WIP limit back to two our throughput took a while to return to the original values. That’s because of the cost of onboarding two new developers. Everyone in the team was going slower to take time to explain things to them and to let them learn.
Metrics that generate questions, not just answers
Mattia’s team was having one of their (usually) monthly metrics review meetings. Because of a very busy period more than two months had passed since the previous metrics review meeting.
We noticed a significant drop in the throughput trend, which initially surprised us. “What could possibly be causing this drop? Does this confirm our feelings?” we asked. As soon as we started discussing it we realized that actually most people were feeling like it hadn’t been such a productive period - being very busy didn’t result in more work done, and actually some people admitted to having felt frustrated and having lost some motivation as a result.
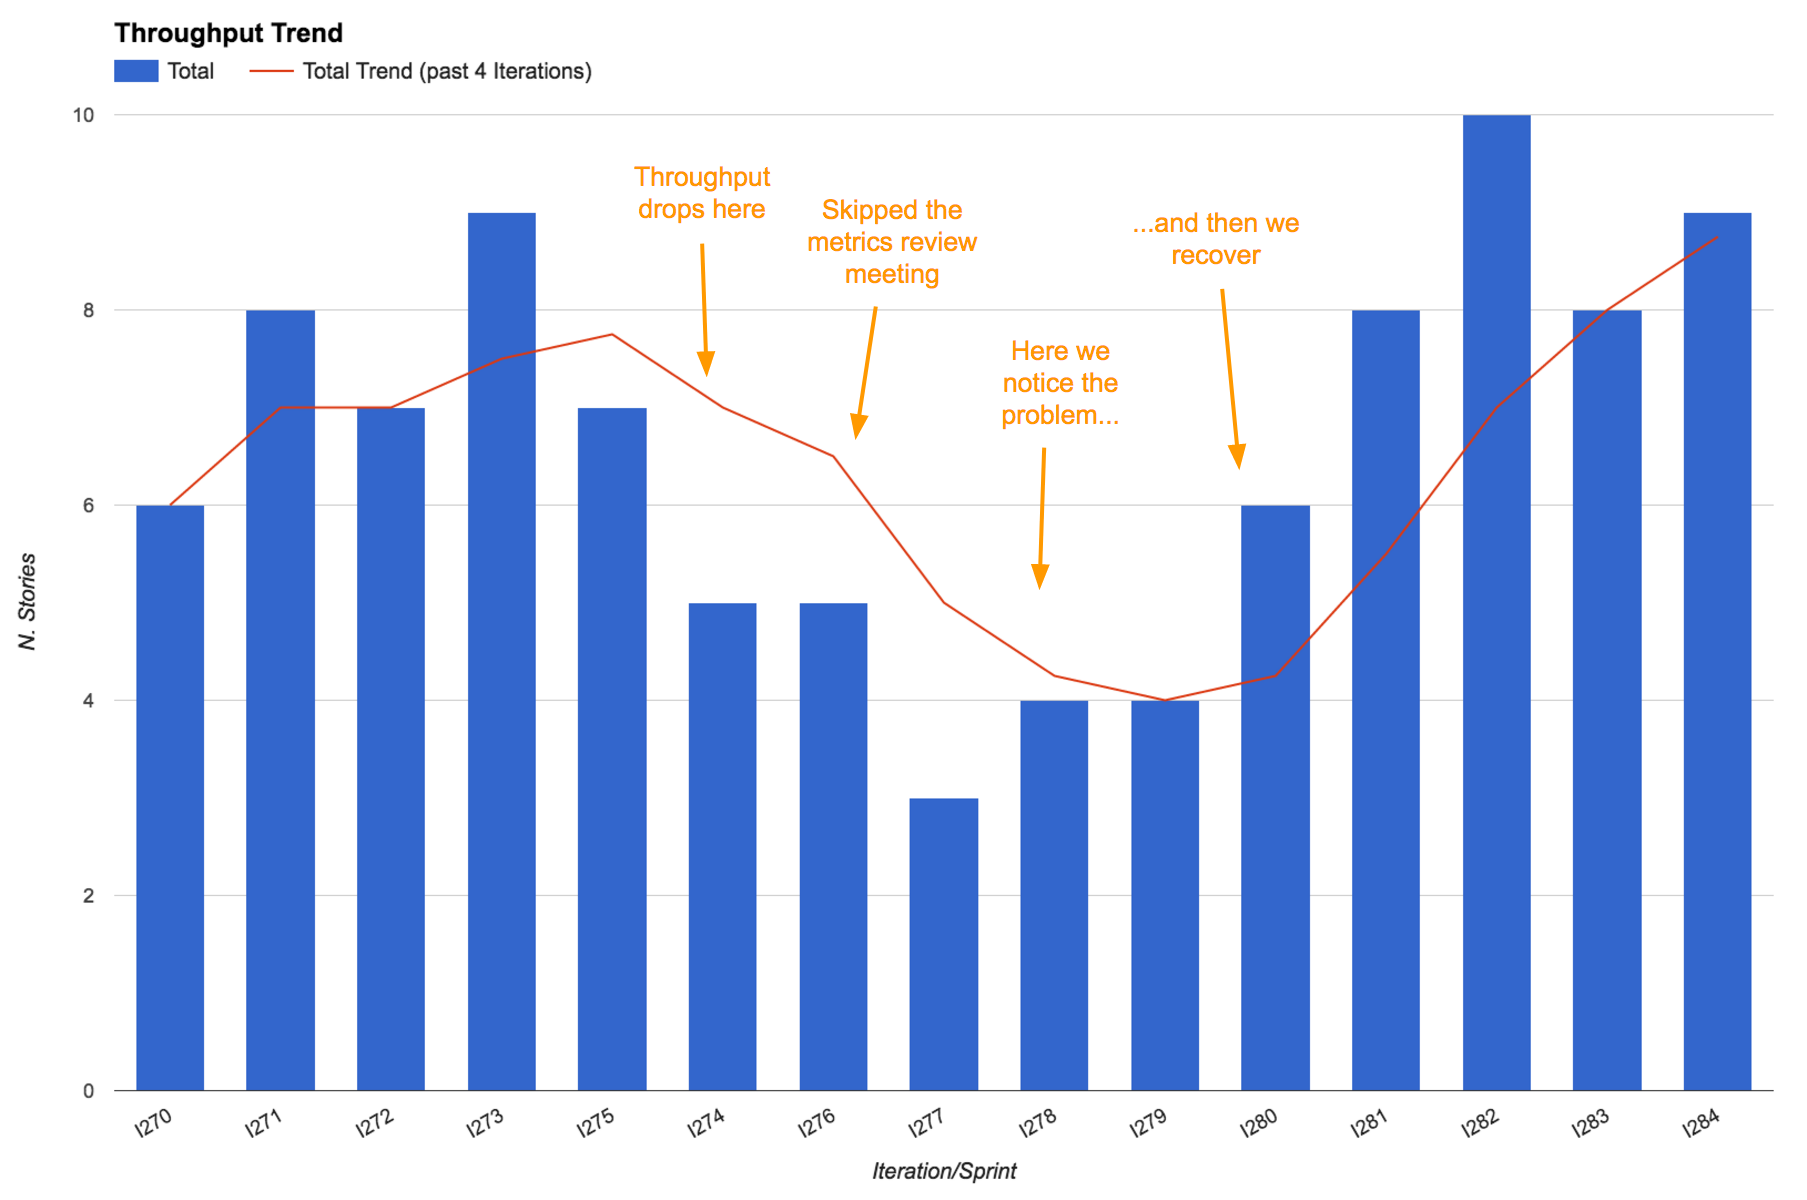
Thanks to our metrics, a problem that was lying below the surface and intoxicating the team had become apparent, giving us a chance to fix it! We had a few retrospectives about these problems, identified some of the root causes and managed to recover, even increasing our throughput, when compared to before the busy period.
Remember, good metrics should surprise you every now and then. It’s important that they generate questions as well, not just answers!
7.6 Use throughput for long term predictions
“How long will it take?”
“When are we going to complete this project/functionality/group of stories?”
Suppose we’re analyzing a new project or a new piece of functionality and we need to answer the perennial questions “How long will it take? When will it be ready?”.
If a simple back-of-the-envelope answer is enough for us then we can use the throughput average to make a simple linear projection, in a burn-up chart style.
Bear in mind that using an average for making plans or predictions can be very dangerous (the so called “Flaw of Averages”: Plans based on average assumptions are wrong on average (Savage2012)). But if all you’re trying to do is get a rough idea of duration then this could be enough.
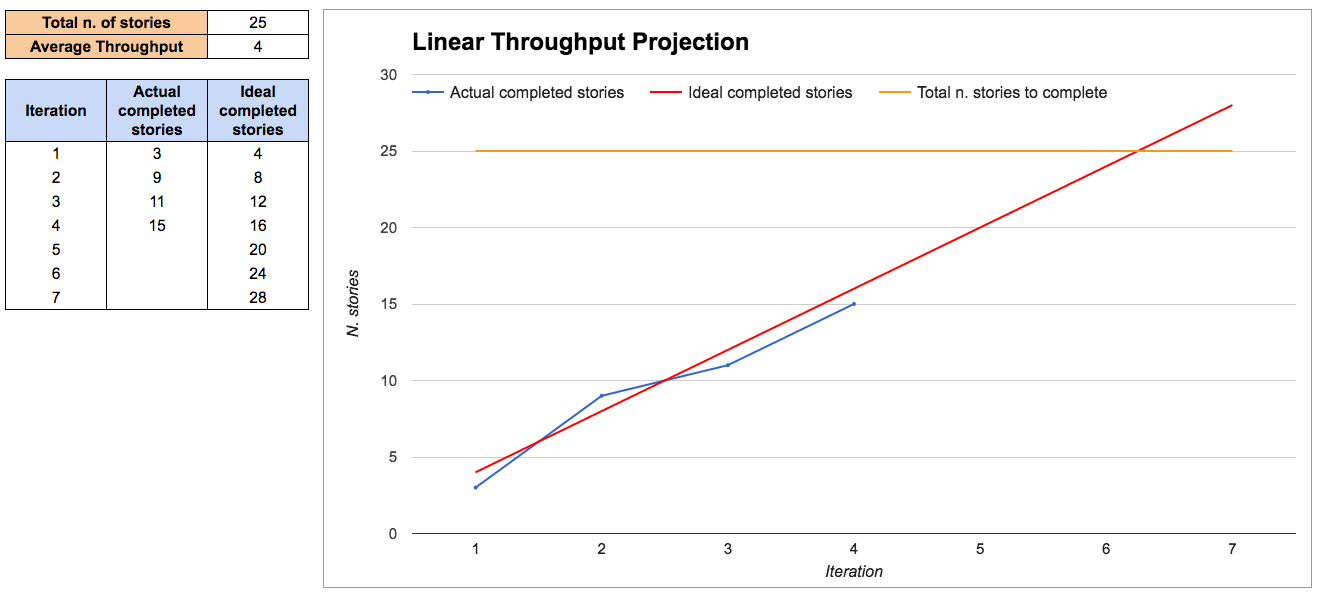
This approach assumes that you know how many stories you will need to complete, which is not always easy at the beginning of a project. There are some techniques to help you with this that we cover in chapter 6.
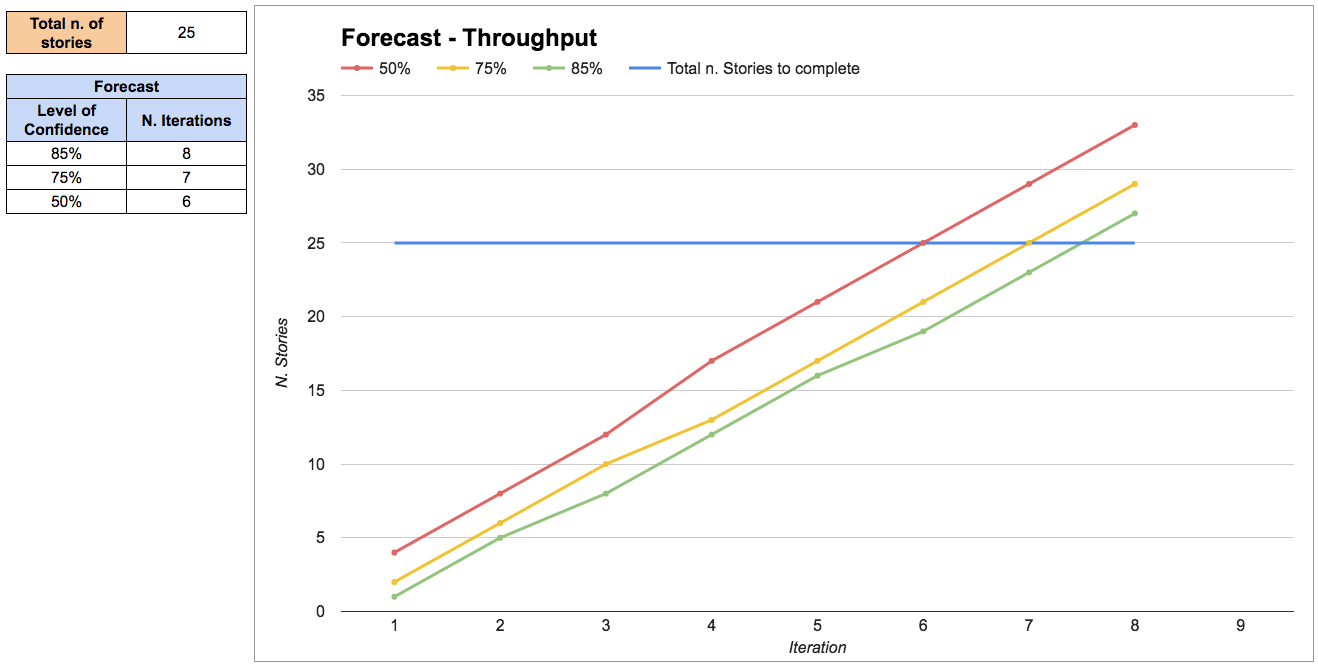
If you want more precision and, more importantly, if you need to manage the risks of the project, it’s better to use throughput as an input to do probabilistic forecasting.
Probabilistic forecasting is explained in detail in the chapter on “Forecasting and planning”. Briefly, it works by extracting random throughput samples from our historical data in order to simulate how much work the team will complete in each iteration. This is called a Montecarlo simulation.
The results are expressed as a range of probabilities: we’re 85% confident that we can complete this group of stories in eight iterations, but we’re only 50% confident that we complete it in six iterations.
Real-life examples
Making predictions on the fly
Mattia and his team were discussing a new piece of functionality that would support the launch of a new product. Our business analyst (BA) presented the problem to the rest of the team, and we discussed possible solutions.
After agreeing on one solution, we broke it down into stories. Then the BA asked the perennial question “How long will this take?”. We grabbed our throughput stats that we keep printed by our Kanban board, and quickly answered: “Well, we have ten stories here and our average throughput is three stories per iteration. So it looks like it would be roughly something around three to four iterations. Is this enough to answer your question? If not you can give us five minutes, and we’ll plug these numbers into our forecasting spreadsheet to provide a more accurate forecast”.
The BA replied “No don’t worry, that’s fine already. I just wanted to know if this would be ready for the launch of the new product in 6 iterations time. Sounds like we’ll be fine”. The meeting was over in less than an hour and we got started on that new functionality straight away.
7.7 Debunking some myths
“This only works if I have a lot of data”
You can start with a lot less data than you think:
- With 5 samples we are confident that the median will fall inside the range of those 5 samples, so that already gives us an idea about our timing and we can make some simple projections (see “rule of five (Vacanti2015)”).
- With 11 samples we are confident that we know the whole range, as there is a 90% probability that every other sample will fall in that range (see the “German tank Problem (GermanTankProblem)”). Knowing the range of possible values drastically reduces uncertainty.
After that, each extra sample helps to further refine our precision. But a little data is enough to start. Also, when you have no data at all, even a small amount of data is a great improvement and can put you in the right ballpark.
“This only works if all stories have the same size”
This is a myth. It doesn’t matter if stories have different size. There is only one size that we care about: “small enough”. As long as we split stories as small as possible, then it doesn’t matter if they have different size, and we simply use throughput to make predictions.
First, as discussed in the story points paragraph, the size of a story has little correlation with its lead time. So even if you think two stories have the same size, they can take a very different amount of time.
Second, the lead time for stories of the same work item type will follow a known distribution, regardless of their size.
“This is easy to cheat, I’ll just create a lot of tiny stories”
Well, yes, but in this case that’s actually a useful side effect. Smaller stories have a number of benefits, so encouraging that behavior is not a problem.
There is a point where stories become so small that the overhead of managing so many stories becomes greater than the benefits, but the team should be mature enough to realize when that’s happening.
7.8 Public resources
In this book’s public repository (https://github.com/SkeltonThatcher/bizmetrics-book) you can find some useful resources for putting what we’ve talked about into practice:
- Link to a public Trello board that demonstrates how you can track information for your stories, including sprint when they were completed.
- Link to example spreadsheets that show how to analyze your data and generate all the throughput information that we’ve talked about.
7.9 Get started!
- Initially, don’t drop whatever process you’re currently following, but start collecting data and calculating your throughput. Simply count how many stories you have completed in each sprint.
- Use throughput at the next planning session to predict what you can achieve in the following sprint. Compare it with your usual velocity-based estimates.
- Use throughput for the next project to predict how long it will take. Compare it with your usual velocity-based estimates.
- Use throughput in the next retrospective to discuss if you’re improving. Does it spark useful conversations?
- Compare your story points and throughput data and decide what gives you better predictability. If you decide to stop using story points, having data is going to be extremely helpful when it comes to convincing skeptical people.
7.10 Summary
Most teams have a need for predictability. We need to answer questions like “How much work can we complete? How long will it take? Are we nearly there yet?”. Using the team’s throughput we know how fast we’re going and we can answer those questions.
By looking at our past throughput we can predict with confidence how much work we can complete in an iteration. The team becomes more predictable, making planning a lot easier.
Keeping an eye on throughput we can validate our experiments and decide whether the team is improving or not.