6. Introduction


“Why should the team care about metrics?”
How can software teams keep a laser-like focus on outcomes whilst improving practices and flow? How can software teams understand where the bottlenecks are in their processes? And how can software teams provide reliable forecasts of when work will be done? The answer to these questions is: software teams should use Business Metrics. Teams that use Business Metrics understand Throughput, Lead Time, Forecasting, Flow, Quality, and Value - all measures that speak directly to business outcomes. By using Business Metrics, your software team will produce software that is more business-relevant with more certainty and less waste.
6.1 What is covered in this book
Our goal in this book is to equip teams with the means to help them measure the value and quality of their work together with the time and resources required to get the work done.
By doing this we hope to make it easier for teams to work on the things that matter the most, both to the team and the wider business or organization for which they work, and do so at the right time.
To be able to measure you need metrics. Metrics give teams a shared, tractable, resource which can be poked and prodded, questioned and explored. From these metrics come conversations and insights that we have found help teams succeed.
What we are not trying to do is tell teams how to do the work. This is not a methodology book. It’s not about how to use Kanban, Scrum or whatever your preferred way of working is. Rather it is about how to instrument the work and its outcomes in order to make both better for everyone involved.
6.2 All the time in the world
Time is an executive’s scarcest and most precious resource. And organizations - whether government agencies, businesses, or nonprofits - are inherently time wasters.
– Peter F. Drucker The Effective Executive
As we and our teams build and run software we are continually asking and being asked questions:
- How much do we have left to do this week/month/year?
- How much time do we have to finish this?
- How long does it take us to deliver things?
- How much does it cost per month to operate our software?
- What should we do next?
These questions all have one thing in common. They are about our use of and the value of time. To help us answer these questions we need to measure. And we must always measure over time.
For example, say we are running an e-commerce website and we measure how many people are using our website at any given time. Just knowing that there are 1000 people using our website right now isn’t particularly useful.
If, on the other hand, we know that we usually have 1000 people at a time between nine in the morning and five in the evening but that this number drops off to only 100 overnight we can use that information to decide how much computing resources we want to put in place at what time of the day.
Or, to take another example, we notice that over the past few weeks the number of defects being logged against our system has been going up at a steady rate, from two defects/week to four, then six and now eight defects/week. Then we know we have a trend that we should be worried about.
This is an actionable book primarily for teams as time is the entire team’s scarcest and most precious resource. Time is wasted if we don’t know what we should be working on and when.
6.3 Value, quality, & operational metrics
We can split metrics into three tiers based on their purpose. Each tier supports the ones above it:
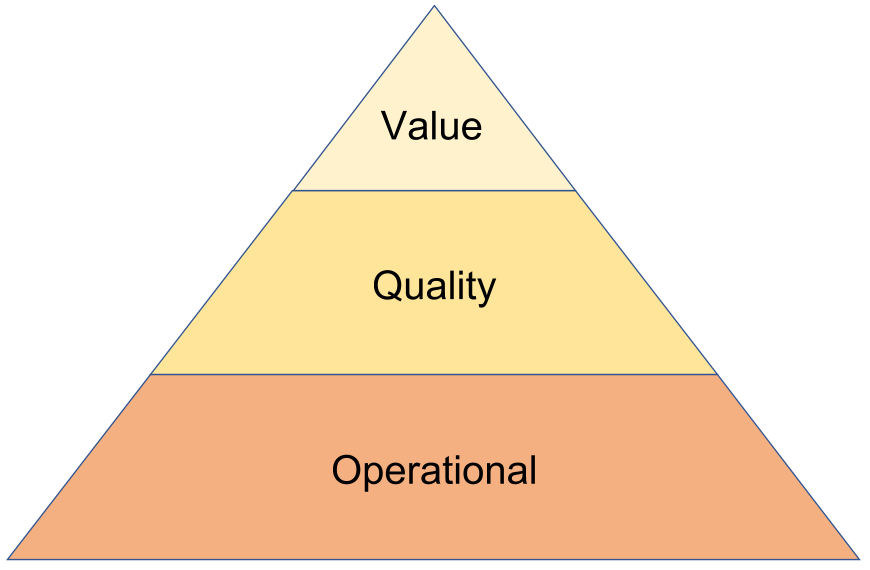
At the bottom we have operational metrics. These are the underlying ‘hygiene factors’ that indicate the ways of working required to produce the value and quality outcomes required: throughput, flow, variability, and so on. These metrics cast a light into otherwise dark corners and give us situational awareness.
Next comes quality. We want to be able to measure the quality both of the work we produce and also how we produce it (how we operate). The quality of the work we do affects both the operational effectiveness and its value. If our code is full of bugs then this prevents people using it from getting value out of it. Plus we spend more of our time fixing those bugs rather than delivering valuable new features.
At the top is value. This is where we want to end up, being able to measure the value of our work - the outcomes and results it produces. Otherwise, how do we know it is worth doing and spending time on in the first place?
Operational metrics
We start at the base of the pyramid with operational metrics.
We need these to be able to answer questions like:
- How much do we have left to do this week/month/year?
- How much time do we have to finish this?
- How long does it take us to deliver things?
To answer these questions we need metrics derived from how the team works, as opposed to their output. We measure things like:
- Delivery rate - also called throughput. How fast is the team delivering the work?
- Cycle time - also called lead time. How long does it take the team to complete the work?
We suggest that teams start by looking at their operational metrics as these are within the team’s Zone of Control. They can then be used as an example to those within the team’s Sphere of Influence (Adzic2014) such as customers, product managers or heads of business.
Quality metrics
Once we can see our operational metrics, we are in a position to look at the quality of the work we are doing. Like operational concerns, quality is within the team’s zone of control. As David Anderson put it “[quality] is a technical discipline that can be directed by the function manager” (Anderson2010). It is something that as a technical or engineering team you own.
Raising the quality of your work - “getting your own house in order” - puts you in a good position to have fruitful conversations with your customers and collaborators, and is a way of strengthening trust with them.
We need to be able to answer questions like:
- Does our software consistently do what people expect it to do?
- Is our software available at the times and in the places where people need it?
- When things go wrong with our software, what does it take to get them fixed?
A way of qualifying, quantifying and then measuring quality is to think of it in terms of what John Seddon calls “failure demand”:
Value demand is ‘demand we want’, demand that the service is there to provide. Failure demand is demand caused by a failure to do something or do something right for the customer.
– John Seddon “Systems Thinking in the Public Sector”
For a team building and running software, failure demand is caused either by the defects in the software put into production or by building something that doesn’t fulfil the customer needs, that is something that does not provide value.
Value metrics
In our experience there is rarely a shortage in the supply of ideas for things to do with a team’s scarce time. We need to know which of those are going to create value.
This means we need to be able to answer questions like:
- What should we do?
- When should we do it?
- What should we do next?
To answer this we need some measure of the worth of what we seek to achieve and the degree to which our actions are having the desired outcome. These are our value metrics.
For example:
- How many customers have we gained this month?
- How much are they spending?
- Which features are they using the most?
- How long do people stay with us as customers?
- Do they recommend us to their friends?
Value metrics help to provide a common goal for the team by emphasizing the purpose and outcomes of the software, reducing the time needed for decision making and avoiding time wasted on interesting but less valuable work.
6.4 How to use this book
The metrics we generate are not an end in themselves. They are there to answer questions and to enable the team to make better business decisions. Each chapter of this book poses one of the questions we hear the most when working with teams:
- Chapter on Throughput - How fast are we going?
In the fast-paced world of software development we have found that it is all too easy to lose track of how much you can actually get done in say a week or a month. When demand from your customers is piling up, by looking at the operational metric ‘Throughput’ you can get a handle on how well balanced your capability is to deliver against this demand.
- Chapter on Lead Time - How long will this take?
How long is a piece of string? Software is complex and requirements are emergent. Both customers and the team want to know how long a piece of work is going to take to complete. By looking at the operational metrics “Lead Time” and “Cycle Time” we show you how to answer this perennial question.
- Chapter on Forecasting and planning - When will it be done?
Now we’re motoring. We have a predictable delivery rate and can give our customers realistic expectations of when individual pieces of work will get done. When it comes to bigger chunks of work though, like epics or projects, questions remain: When will it be done? How much can we do by a particular date? In this chapter we look at how to make forecasts that help us take those decisions with confidence, dealing with uncertainty and highlighting risks early on.
- Chapter on Flow - Where’s the bottleneck?
As we look at queues of work alongside work that is in progress we will see that some of the queues are longer than others. Where these ‘bottlenecks’ appear tells us a lot about how we are working and what we can do to improve it.
- Chapter on Metrics for Quality - How do we know this works?
There is no point knowing how quickly we can deliver ‘stuff’ if that stuff doesn’t work. In this chapter we look at the concept of “Failure Demand”. We see how we can measure it and look at ways to remove it from the equation.
- Chapter on Metrics for Value - Why are we making this software?
Value metrics help us to answer the question “Why are we doing this?”. You could even decide to ‘Start with Why’ as Simon Sinek famously said (Sinek2011) and read this chapter first. The other chapters are all about “getting the house in order” - doing a great job. Value metrics help us to take this practice of instrumenting and reflecting upon our work and apply it to the outcomes and purpose of the work itself. We can start measuring the impact of our work: by choosing to measure impact we prompt conversations about purpose (“why?”).
6.5 Get Started!
Each chapter is readable independently, containing the necessary level of detail to be understood and actionable on its own, without requiring any of the other chapters in the book to be read first (although certainly reading the full book will provide a more comprehensive understanding of the concepts and practices and their inter-relations).
We’ve structured the book in an order that is intended to take you and your team from a practice with no metrics to one where metrics are driving your day-to-day decisions about the work.
That doesn’t mean you have to read it linearly cover to cover. This is a book for teams and we suggest you start with a conversation with the other members of your team about what is and what is not working for you.
Ask them the questions above - ‘How fast are we going?’, ‘What are we doing next?’, ‘Why are we making this software’ etc. - and see how much interest you get and what answers people have. Which question do they most want answering? Our thesis in this book is that these questions are best answered by using metrics. By working through the chapters with your team you should be able to discover more about the work you are doing and better answer the questions.
6.6 Feedback and suggestions
We’d welcome feedback and suggestions for changes.
Please contact us at:
- email: info@bizmetricsbook.com
- Twitter: @BizMetricsBook
- Leanpub: leanpub.com/metricsforbusinessdecisions/feedback
Mattia Battiston & Chris Young