Leaflet Plugins
Since the stated aim of leaflet.js is to provide a JavaScript library for drawing maps that is simple, with good performance and usability, there are many features that it could include which it doesn’t. The idea being that not everyone is going to use those features, therefore there is no benefit to increasing the size of leaflet and impacting performance.
Instead the awesomeness of Leaflet is increased by encouraging third party contributors to craft their own plugins that can leverage the core library capabilities to expand functionality on a feature by feature basis.
At time of writing (December 2013) there are almost exactly 100 different plugins covering a huge range of options.
Leaflet.draw
Leaflet.draw adds support for drawing and editing vectors and markers overlaid onto Leaflet maps. Its driving force is Jacob Toye (a good Hamilton lad, so he gets a special shout-out :-)).
It is a comprehensive plugin that can add polylines, polygons, rectangles, circles and markers to a map and then edit or delete those objects as desired. It has an extensive range of options for configuring the drawing objects ‘look and feel’. It’s code is supported on GitHub and it can be downloaded from there. There is also some great documentation on function and use for the plugin that should be the authority for use.
Leaflet.draw is less of an endpoint, than an enabler of additional functionality. I say this because while it gives us the ability to draw to our hearts content on a map, it also provides the framework to take those drawn objects and push them to a database or similar (which we won’t cover in this overview sorry).
What we will go over though is how to add Leaflet.draw to our simple base map and how to configure some of the wide range of options.
Here’s what we are aiming to show in terms of the range of controls and options on the left hand side of our map.
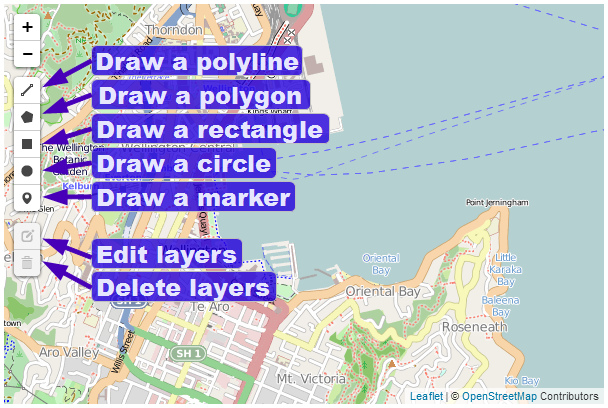
Leaflet.draw toolbar
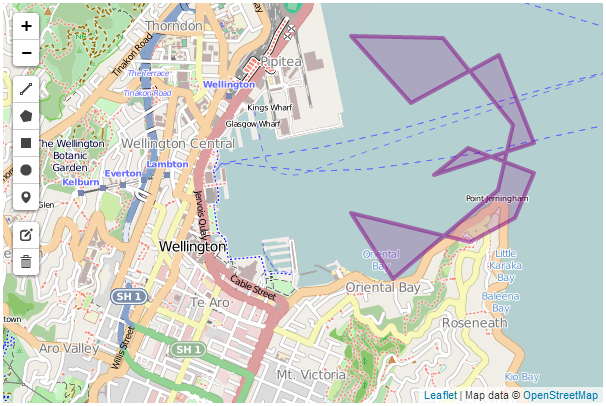
And here’s some example objects produced with the plugin.
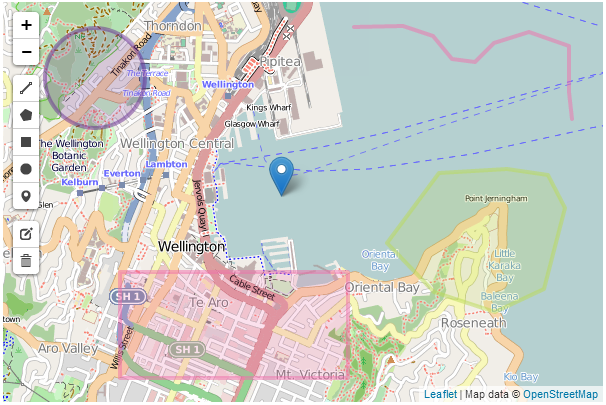
Leaflet.draw sample objects
The colours are configurable as we shall see in the coming pages.
Leaflet.draw code description
The following code listing is the bare minimum that should be considered for use with Leaflet.draw. I even hesitate to say that, because the following is really only suitable for demonstrating that you have it running correctly. The configuration options that we will work through in the coming pages will add considerable functionality and will be captured in a separate example that will be available in the Appendices and online on GitHub.
<!DOCTYPE html>
<html>
<head>
<title>Simple Leaflet Map</title>
<meta charset="utf-8" />
<link
rel="stylesheet"
href="http://cdn.leafletjs.com/leaflet-0.7/leaflet.css"
/>
    <link
        rel="stylesheet"
        href="http://leaflet.github.io/Leaflet.draw/leaflet.draw.css"
    />
</head>
<body>
<div id="map" style="width: 600px; height: 400px"></div>
<script
src="http://cdn.leafletjs.com/leaflet-0.7/leaflet.js">
</script>
    <script
        src="http://leaflet.github.io/Leaflet.draw/leaflet.draw.js">
    </script>
<script>
var map = L.map('map').setView([-41.2858, 174.78682], 14);
mapLink =
'<a href="http://openstreetmap.org">OpenStreetMap</a>';
L.tileLayer(
'http://{s}.tile.openstreetmap.org/{z}/{x}/{y}.png', {
attribution: '© ' + mapLink + ' Contributors',
maxZoom: 18,
}).addTo(map);
        var drawnItems = new L.FeatureGroup();
        map.addLayer(drawnItems);

        var drawControl = new L.Control.Draw({
            edit: {
                featureGroup: drawnItems
            }
        });
        map.addControl(drawControl);

        map.on('draw:created', function (e) {
            var type = e.layerType,
                layer = e.layer;
            drawnItems.addLayer(layer);
        });
</script>
</body>
</html>
There are only three ‘blocks’ that have changed in the code from our simple map example.
The first is an additional link to load more CSS code;
<link
rel="stylesheet"
href="http://leaflet.github.io/Leaflet.draw/leaflet.draw.css"
/>
(As with the leaflet.css file which is loaded before hand, I have taken some small formatting liberties to make the code appear more readable on the page.)
This loads the file directly from the Leaflet.draw repository on GitHub, so if you are loading from a local file you will need to adjust the path appropriately.
The second is the block that loads the leaflet.draw.js script.
<script
src="http://leaflet.github.io/Leaflet.draw/leaflet.draw.js">
</script>
Leaflet.draw exists as a separate block of JavaScript code and again, here we are loading the file directly from the Leaflet.draw repository on GitHub (as per the earlier advice, if you are loading from a local file you will need to adjust the path appropriately).
The last change to the file is the block of code that runs and configures Leaflet.draw.
var drawnItems = new L.FeatureGroup();
map.addLayer(drawnItems);
        var drawControl = new L.Control.Draw({
            edit: {
                featureGroup: drawnItems
            }
        });
        map.addControl(drawControl);
        map.on('draw:created', function (e) {
            var type = e.layerType,
                layer = e.layer;
            drawnItems.addLayer(layer);
        });
The var drawnItems = new L.FeatureGroup(); line adds a new extended layer group to the map called drawnItems. This is the layer that the elements we create will be stored on.
Then the map.addLayer(drawnItems); line adds the layer with our drawn items to the map.
Next we get to the first of the true Leaflet.draw commands when we initialize the draw control and pass it the feature group of editable layers;
var drawControl = new L.Control.Draw({
edit: {
featureGroup: drawnItems
}
});
map.addControl(drawControl);
This is required when adding the edit toolbar and tells the Leaflet.draw plugin which layer (drawnItems) should be editable. Then the controls are added to the map (map.addControl(drawControl);).
Finally when we add a new vector or marker we need prompt a trigger that captures the type of item we have created (polyline, rectangle etc) and adds it to the drawn items layer on the map.
map.on('draw:created', function (e) {
var type = e.layerType,
layer = e.layer;
drawnItems.addLayer(layer);
});
This is alto the part of the code where you could store the information that described the element in a database or similar.
Leaflet.draw configuration options
As I mentioned earlier, the sample code described above is extremely cut down and should be extended using the wide range of options available to Leaflet.draw.
Object colours
As our first change, if we use the simple example, all of the elements we generate have the same colour, so lets change that first.
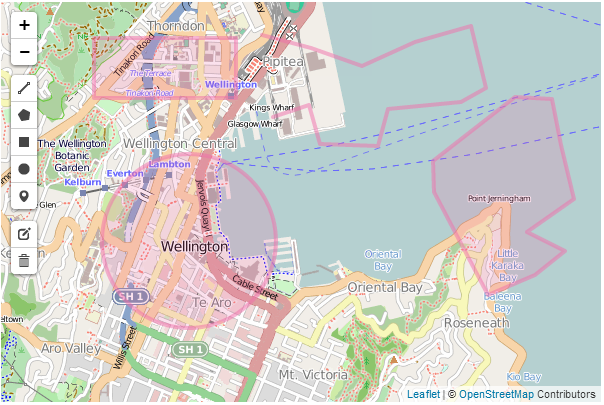
Leaflet.draw map with common colours
Changing the options is a simple matter of declaring them when we initialize the draw controls by adding them as required by the documentation on the Leaflet.draw GitHub page. For example in the following code snippet we have added in the draw: option which in turn has options for each of the shapes. We have entered the polygon: option which has it’s own options of which we have added shapeOptions: as an option. And as if that wasn’t enough we select the option for color: from this and finally declare it as purple.
        var drawControl = new L.Control.Draw({
			draw: {
				polygon: {
					shapeOptions: {
						color: 'purple'
					},
				},
			},
            edit: {
                featureGroup: drawnItems
            }
        });
        map.addControl(drawControl);
This might seem slightly confusing, but it’s just a simple hierarchy which we can flesh out by doing the same thing for each of the remaining shapes (polyline, rectangle and circle). The code snippet would then look as follows;
		var drawControl = new L.Control.Draw({
			draw: {
				polygon: {
					shapeOptions: {
						color: 'purple'
					},
				},
				polyline: {
					shapeOptions: {
						color: 'red'
					},
				},
				rect: {
					shapeOptions: {
						color: 'green'
					},
				},
				circle: {
					shapeOptions: {
						color: 'steelblue'
					},
				},
			},
			edit: {
				featureGroup: drawnItems
			}
		});
		map.addControl(drawControl);
And our new colours look like this…
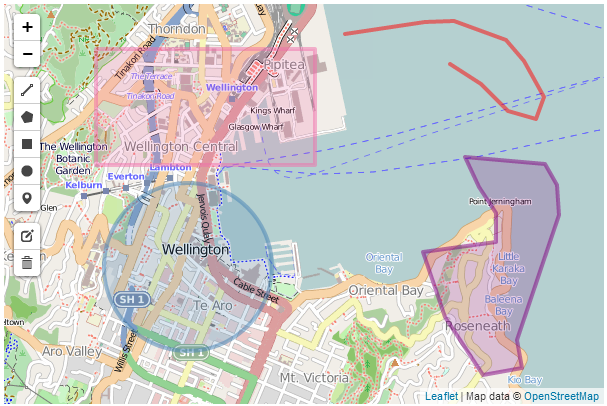
Leaflet.draw map with various colours
Polygon line intersection
When drawing a polygon it is very easy to cross the lines when describing our object on the screen, and while this may be a desired action, in general it is probably not. However as our code stands, if we tell the script to cross the lines and draw a polygon it will do it with a (perhaps unintended) result looking something like the following…
Leaflet.draw polygon with crossed lines
Luckily there is an option that will provide a warning that this is happening while drawing and will allow you to correct and carry on. The following screen shot shows the results when trying to place a point that allows boundary lines to cross;
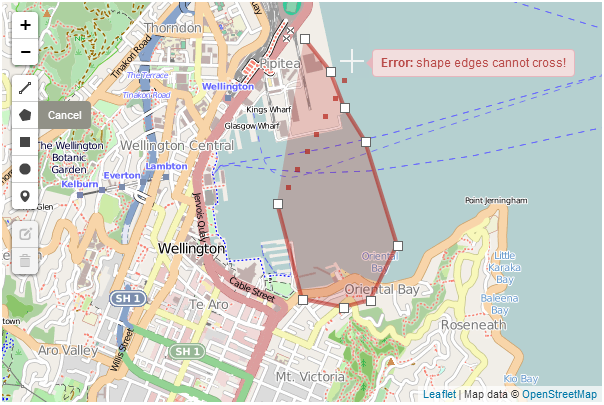
Leaflet.draw polygon with crossed lines
We can see that not only is a warning raised, but the shape colour changes.
This is accomplished by alteration of the polygon options as follows;
				polygon: {
					shapeOptions: {
						color: 'purple'
					},
					allowIntersection: false,
					drawError: {
						color: 'orange',
						timeout: 1000
					},
				},
This has introduced the allowIntersection option and set it to false and provided the drawError option with the instructions to change the colour of the object to orange for 1000 milliseconds.
This option will also work with polyline objects.
Show and measure an area
While tracing a polygon we can get Leaflet.draw to report the total area spanned by the shape by setting the showArea option to true.
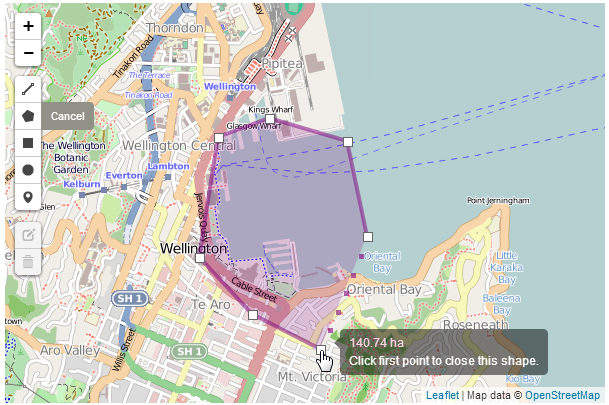
Leaflet.draw polygon showing area
You can see from the screen shot that the area is in hectares, but we can set the measurement units to not be metric (to show acres instead) by setting the metric option to false. The code for the polygon now looks like this;
				polygon: {
					shapeOptions: {
						color: 'purple'
					},
					allowIntersection: false,
					drawError: {
						color: 'orange',
						timeout: 1000
					},
					showArea: true,
					metric: false
				},
Repeating a drawing option automatically
By default once we have finished drawing a polygon, if we wanted to draw another, we would need to click on the polygon tool on the toolbar to start again. But we can use the repeatMode set to true to continue to dray polygons until we select another object to draw or until we press the escape key.
Our polygon option code will now look like this;
				polygon: {
					shapeOptions: {
						color: 'purple'
					},
					allowIntersection: false,
					drawError: {
						color: 'orange',
						timeout: 1000
					},
					showArea: true,
					metric: false,
					repeatMode: true
				},
This option will work with all the other drawing objects.
Place an alternative marker
If an alternative marker has been declared (see section on setting up different markers) it can be specified under the marker option as an alternative icon.
The code to set up an alternative icon duplicates is covered elsewhere, but consists of the following;
		var LeafIcon = L.Icon.extend({
			options: {
				shadowUrl:
				    'http://leafletjs.com/docs/images/leaf-shadow.png',
				iconSize:     [38, 95],
				shadowSize:   [50, 64],
				iconAnchor:   [22, 94],
				shadowAnchor: [4, 62],
				popupAnchor:  [-3, -76]
			}
		});

		var greenIcon = new LeafIcon({
			iconUrl: 'http://leafletjs.com/docs/images/leaf-green.png'
			});
Here we are using one of the markers (the green leaf) set up as part of the custom icons tutorial on GitHub.
And the option code to be added to include an alternative marker is;
				marker: {
					icon: greenIcon
				},
And here’s a pretty picture of the green marker.
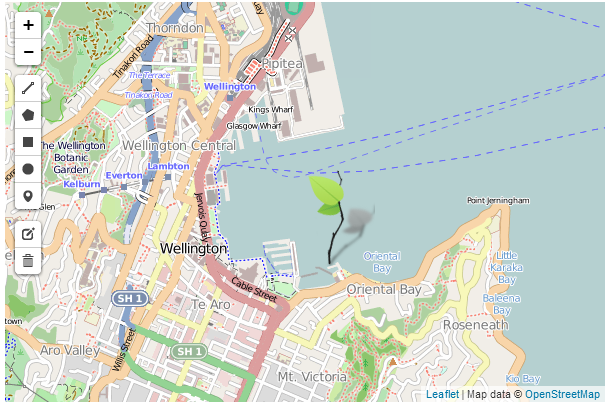
Add a custom marker
Place the Leaflet.draw toolbar in another position
The toolbar position can also be changed. This is configured via an option that is quite high up the hierarchy (in parallel with the draw and edit options). So this should be added directly under the drawControl declaration per the following code snippet;
		var drawControl = new L.Control.Draw({
			position: 'topright',
This will place the toolbar in the top right hand corner of the map as follows;
Moving the Leaflet.draw toolbar
The other options for positioning are bottomright, bottomleft and the default of topleft.
The full code and a live example of the use of the Leaflet.draw plugin with the options described here in the appendices and is available online at bl.ocks.org or GitHub. A copy of all the files that appear in the book can be downloaded (in a zip file) when you download the book from Leanpub.
OSMGeocoder Search
The OSMGeocoder plugin adds a search facility to a leaflet map that uses the OpenStreetMap tool ‘Nominatim’ to search for a location and provide a reverse geolocation on the search term to pinpoint the position on the map.
The plugin was developed by ‘kartenkarsten’ and is hosted on GitHub where it can be downloaded from.
There are a number of configurable options which we shall describe in a moment.
OSMGeocoder code description
The following code is a ‘bare bones’ listing which we will flesh out with some options. The version with the added options will be in the appendices and there will be a link to a live version on bl.ocks.org.
<!DOCTYPE html>
<html>
<head>
<title>osmGeocoder Search Plugin for Leaflet Map</title>
<meta charset="utf-8" />
<link
rel="stylesheet"
href="http://cdn.leafletjs.com/leaflet-0.7/leaflet.css"
/>
<link
rel="stylesheet"
href="http://k4r573n.github.io/leaflet-control-osm-geocoder/Control.OS\
MGeocoder.css"
/>
</head>
<body>
<div id="map" style="width: 600px; height: 400px"></div>
<script
src="http://cdn.leafletjs.com/leaflet-0.7/leaflet.js">
</script>
<script
src="http://k4r573n.github.io/leaflet-control-osm-geocoder/Control.OSM\
Geocoder.js">
</script>
<script>
var map = L.map('map').setView([-41.2858, 174.78682], 14);
mapLink =
'<a href="http://openstreetmap.org">OpenStreetMap</a>';
L.tileLayer(
'http://{s}.tile.openstreetmap.org/{z}/{x}/{y}.png', {
attribution: '© ' + mapLink + ' Contributors',
maxZoom: 18,
}).addTo(map);
var osmGeocoder = new L.Control.OSMGeocoder();
map.addControl(osmGeocoder);
</script>
</body>
</html>
There are only three ‘blocks’ that have changed in the code from our simple map example.
The first is an additional link to load more CSS code;
<link
    rel="stylesheet"
    href="http://k4r573n.github.io/leaflet-control-osm-geocoder/Control.OSMGeo\
coder.css"
/>
(Because of the length of the URL for the file, the formatting may make cutting and pasting from the ebook problematic. For a more reliable snippet of code, download the live version from GitHub)
This loads the file directly from the OSMGeocoder repository on GitHub, so if you are loading from a local file you will need to adjust the path appropriately.
The second is the block that loads the Control.OSMGeocoder.js script.
<script
    src="http://k4r573n.github.io/leaflet-control-osm-geocoder/Control.OSMGeoc\
oder.js">
</script>
(Again because of the length of the URL for the file, the formatting may make cutting and pasting from the ebook problematic. For a more reliable snippet of code, download the live version from GitHub).
Control.OSMGeocoder.js exists as a separate block of JavaScript code and again, here we are loading the file directly from the OSMGeocoder repository on GitHub (as per the earlier advice, if you are loading from a local file you will need to adjust the path appropriately).
The last change to the file is the block of code that runs and configures Leaflet.draw.
        var osmGeocoder = new L.Control.OSMGeocoder();

        map.addControl(osmGeocoder);
The fist line (var osmGeocoder = new L.Control.OSMGeocoder();) initializes the osmGeocoder control and the second (map.addControl(osmGeocoder);) adds the search controls to the map.
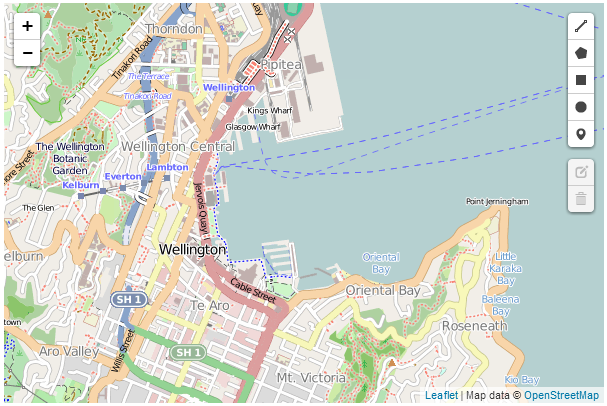
There is not a lot of additional code required to get this plugin up and running and the following is what we see on the screen;
OSMGeocoder plugin
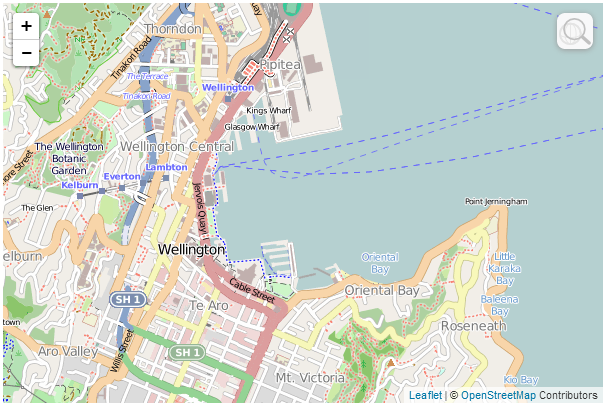
The only noticeable addition is a svelte magnifying glass in the top left hand corner. If we hover our mouse over the magnifying glass a search box appears.
OSMGeocoder plugin
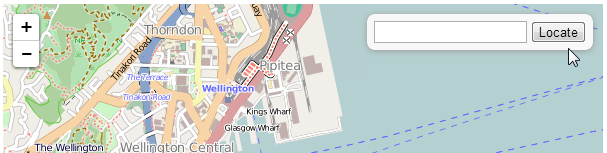
If we then type in an address and click on ‘locate’…
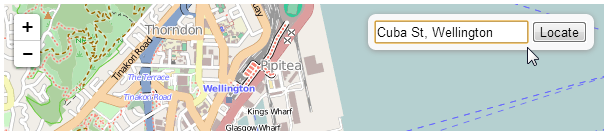
OSMGeocoder plugin
… we are taken to a view of the location of our search.
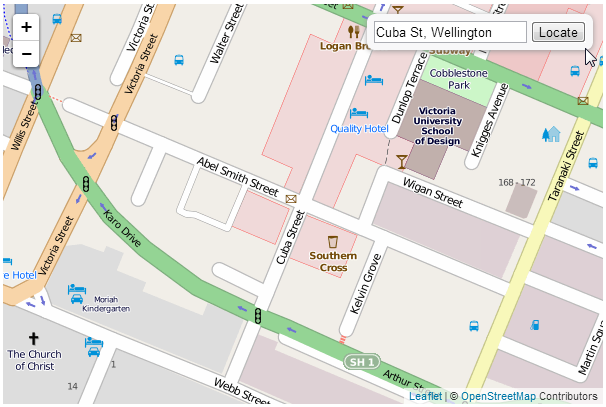
OSMGeocoder plugin
OSMGeocoder configuration options
As I mentioned earlier, the sample code described above is in it’s most basic form and it can be extended using a range of options available to OSMGeocoder.
Adding in options is a simple matter of declaring them when we initialize the OSMGeocoder control. The three options we are going to introduce (there are more, but I’m opting for the simple ones) are to leave the search box up on the screen (no need to hover over the magnifying glass), we will position the search box in the bottom right corner (I’m not advocating this, it’s just for the sake of demonstration) and we will change the text for the button to ‘Find!’. The following are the options added to the OSMGeocoder control that will accomplish this;
        var osmGeocoder = new L.Control.OSMGeocoder({
            collapsed: false,
            position: 'bottomright',
            text: 'Find!',
			});
Resulting in a map that looks a little like this…
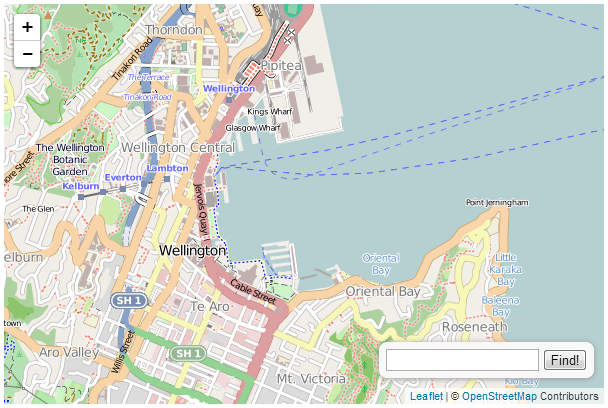
OSMGeocoder plugin
A copy of this file and all the files that appear in the book can be downloaded (in a zip file) when you download the book from Leanpub
Leaflet.FileLayer load local GPX, KML, GeoJSON files
The Leaflet.FileLayer plugin adds the ability to load a gps trace in the form of a KML, GPX or GeoJSON file to a Leaflet map. The idea being that if you have gone on a journey and captured the trip using a gps it can be loaded easily onto a map for viewing.
The plugin was developed by Mathieu Leplatre and is hosted on GitHub where it can be downloaded from.
Leaflet.FileLayer code description
The following is a code listing that we will use to describe the required changes from our simple-map.html example to enable Leaflet.FileLayer. There is also an online version on bl.ocks.org and GitHub.
<!DOCTYPE html>
<html>
<head>
<title>LeafletFileLayer Plugin</title>
<meta charset="utf-8" />
<link
rel="stylesheet"
href="http://cdn.leafletjs.com/leaflet-0.7/leaflet.css"
/>
<link
rel="stylesheet"
href="http://makinacorpus.github.io/Leaflet.FileLayer/Font-Awesome/css\
/font-awesome.min.css"
/>
</head>
<body>
<div id="map" style="width: 600px; height: 400px"></div>
<script
src="http://cdn.leafletjs.com/leaflet-0.7/leaflet.js">
</script>
<script
src="http://makinacorpus.github.io/Leaflet.FileLayer/leaflet.filelayer\
.js">
</script>
<script
src="http://makinacorpus.github.io/Leaflet.FileLayer/togeojson/togeojs\
on.js">
</script>
<script>
var map = L.map('map').setView([-41.2858, 174.78682], 14);
mapLink =
'<a href="http://openstreetmap.org">OpenStreetMap</a>';
L.tileLayer(
'http://{s}.tile.openstreetmap.org/{z}/{x}/{y}.png', {
attribution: '© ' + mapLink + ' Contributors',
maxZoom: 18,
}).addTo(map);
var style = {color:'red', opacity: 1.0, fillOpacity: 1.0, weight: 2, c\
lickable: false};
L.Control.FileLayerLoad.LABEL = '<i class="fa fa-folder-open"></i>';
L.Control.fileLayerLoad({
fitBounds: true,
layerOptions: {style: style,
pointToLayer: function (data, latlng) {
return L.circleMarker(latlng, {style: style});
}},
}).addTo(map);
</script>
</body>
</html>
There are three ‘blocks’ that have changed in the code from our simple map example.
The first is an additional link to load more CSS code;
<link
    rel="stylesheet"
    href="http://makinacorpus.github.io/Leaflet.FileLayer/Font-Awesome/css/fon\
t-awesome.min.css"
/>
(Because of the length of the URL for the file, the formatting may make cutting and pasting from the ebook problematic. For a more reliable snippet of code, download the live version from GitHub)
This loads the css file directly from the Leaflet.FileLayer repository on GitHub, so if you are loading from a local file you will need to adjust the path appropriately.
The second is the block that loads the leaflet.filelayer.js script and an additional script togeojson.js that was written by Tom MacWright to perform the internal conversion of the GPX and KML traces to GeoJSON.
<script
    src="http://makinacorpus.github.io/Leaflet.FileLayer/leaflet.filelayer.js">
</script>
<script
    src="http://makinacorpus.github.io/Leaflet.FileLayer/togeojson/togeojson.j\
s">
</script>
(Again because of the length of the URL for the file, the formatting may make cutting and pasting from the ebook problematic. For a more reliable snippet of code, download the live version from GitHub).
leaflet.filelayer.js exists as a separate block of JavaScript code and we are loading the file directly from the Leaflet.FileLayer repository on GitHub (as per the earlier advice, if you are loading from a local file you will need to adjust the path appropriately). Likewise we are also loading the togeojson.js file from GitHub.
The last change to the file is the block of code that runs and configures Leaflet.FileLayer.
var style = {color:'red', opacity: 1.0, fillOpacity: 1.0, weight: 2, clickable\
: false};
L.Control.FileLayerLoad.LABEL = '<i class="fa fa-folder-open"></i>';
L.Control.fileLayerLoad({
    fitBounds: true,
    layerOptions: {style: style,
                   pointToLayer: function (data, latlng) {
                      return L.circleMarker(latlng, {style: style});
                   }},
}).addTo(map);
The fist line (starting with var style =) sets the styles for the control and the loaded gps traces. Then the icon to initiate the file opening process is declared (L.Control.FileLayerLoad.LABEL = '<i class="fa fa-folder-open"></i>';).
The script then sets the options for Leaflet.FileLayer. The first is the fitBounds option which will present a loaded gps trace in a window that is zoomed to show its full extent. The second is the layerOptions option which will apply the styling to the trace based on our previously declared values (this included the short pointToLayer function that makes circles from point values in the traces).
Lastly we add the layer to our map with .addTo(map).
So when we load our page we can see the folder icon in the top left hand corner.
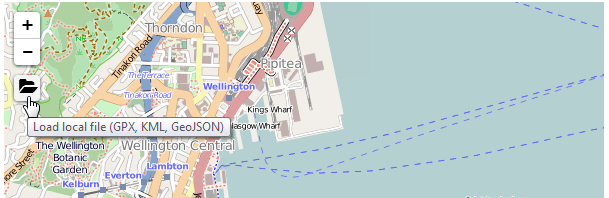
Leaflet.FileLayer plugin
If we click on this folder we will be presented with a dialogue box where we can select a file to load and when we do…
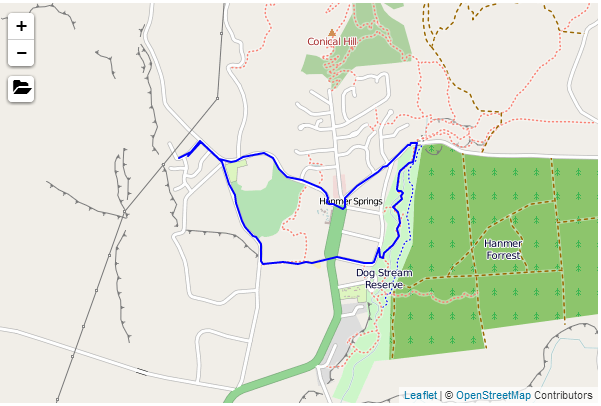
Leaflet.FileLayer plugin with gps trace from Hanmer Springs
Our gps trace is automatically zoomed and panned to present our trace to its full extent.
A copy of this file and a copy of all the files that appear in the book can be downloaded (in a zip file) when you download the book from Leanpub