Leaflet Features
Adding a marker to our map
At some stage we will most likely want to add a marker to our map to pinpoint something. Leaflet makes the process nice and easy by including a marker function with several options;
In its most simple form the following is the full code to show a map with a marker;
<!DOCTYPE html>
<html>
<head>
<title>Marker Leaflet Map</title>
<meta charset="utf-8" />
<link
rel="stylesheet"
href="http://cdn.leafletjs.com/leaflet-0.7/leaflet.css"
/>
</head>
<body>
<div id="map" style="width: 600px; height: 400px"></div>
<script
src="http://cdn.leafletjs.com/leaflet-0.7/leaflet.js">
</script>
<script>
var map = L.map('map').setView([-41.2858, 174.78682], 14);
mapLink =
'<a href="http://openstreetmap.org">OpenStreetMap</a>';
L.tileLayer(
'http://{s}.tile.openstreetmap.org/{z}/{x}/{y}.png', {
attribution: 'Map data © ' + mapLink,
maxZoom: 18,
}).addTo(map);
        var marker = L.marker([-41.29042, 174.78219])
            .addTo(map);
</script>
</body>
</html>
The only difference between this code and the simple map code is the addition of a single line at the bottom of the JavaScript portion;
var marker = L.marker([-41.29042, 174.78219])
.addTo(map);
Here we are declaring a variable with the L.marker method at a point of latitude -41.29042 and longitude 174.78219. Then we simply add that to our map by adding .addTo(map).
And here’s our map complete with marker…
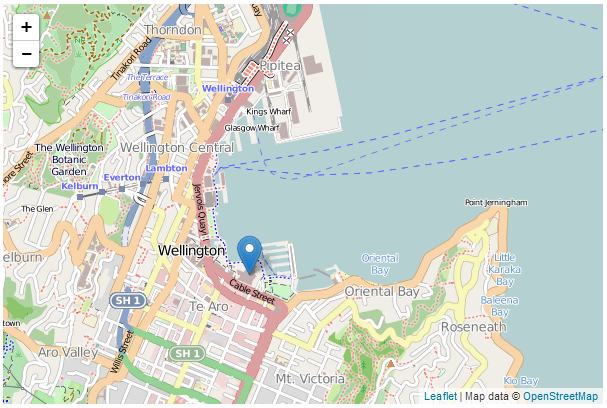
Map with marker
Adding a popup to our marker
Adding a marker couldn’t be any easier, but it’s also not terribly informative in this context. After all, we have no information on what our marker is pointing to. However we can add this context in the form of a popup which is a small text bubble associated with the marker. To do this the code for our marker should look like this;
        var marker = L.marker([-41.29042, 174.78219])
            .addTo(map)
            .bindPopup("<b>Te Papa</b><br>Museum of New Zealand.")
            .openPopup();
Here our additional lines bind a popup to our marker using .bindPopup with the text <b>Te Papa</b><br>Museum of New Zealand. (where the <b> tags will make the text bold and the <br> tag will insert a line break). Then we open the popup with .openPopup().
The end result is…
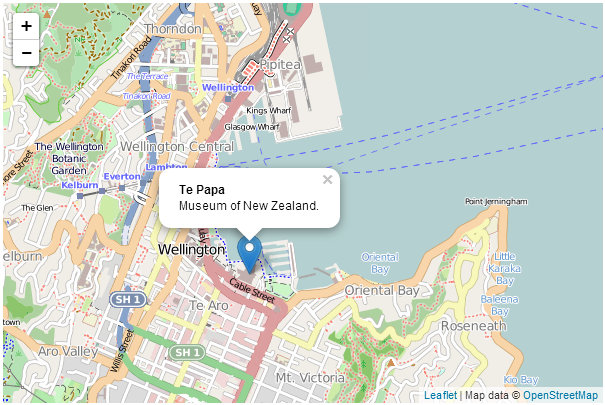
Map with marker
But wait! The coolness doesn’t end there. You can click on the marker and the popup will alternately disappear and return. If you omit the .openPopup() portion the popup won’t be open when your map loads, but if you click on the marker it will open up.
Marker options
As well as the standard marker functions shown thus far there are several options that can be utilised when displaying a marker. These are enabled by including an array of the appropriate options and their desired values in a section contained in curly braces after the latitude, longitude declaration. Below there is some sample code for the marker function with three different options demonstrating use for a boolean value (true / false) a string and a number.
    var marker = L.marker([-41.29042, 174.78219],
        {option1: true,                 // a boolean value
        option2: 'a string lives here', // a string
        option3: 1234}                  // a number
        )
       .addTo(map);
Drag a marker
The draggable option is a boolean which is set to false by default, but when set to true, the marker can be repositioned by clicking on it with the mouse and moving it.
The following is a code example;
    var marker = L.marker([-41.29042, 174.78219],
        {draggable: true}
        )
       .addTo(map);
Add a title to a marker
The title option is a string which will be displayed in a small rectangle beside the pointer when a users mouse is hovered over the marker.
The following is a code example;
    var marker = L.marker([-41.29042, 174.78219],
        {title: 'Hover Text'}
        )
       .addTo(map);
And this is what it looks like…
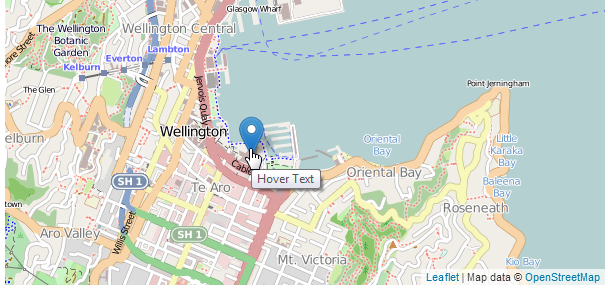
Marker with a title as hover text
Adjust the markers transparency
The opacity option will vary the transparency of the marker from 0 (transparent) to 1 (opaque).
The following is a code example;
    var marker = L.marker([-41.29042, 174.78219],
        {opacity: 0.5}
        )
       .addTo(map);
And this is what it looks like…
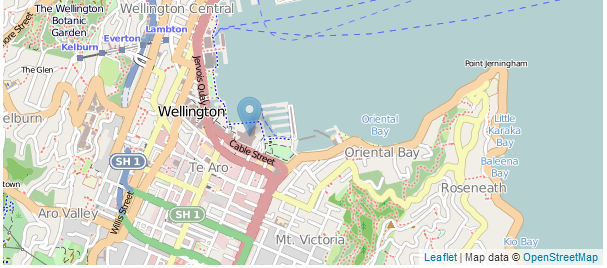
Semi transparent marker
The full code of a live example of a map incorporating a marker with a popup, draggability, a title and opacity are available online at bl.ocks.org or GitHub. A copy is also in the appendices and a copy of all the files that appear in the book can be downloaded (in a zip file) when you download the book from Leanpub.
Adding a line to our map
Adding a line to our map is a great way to provide an indication of a path or border. Leaflet provides the polyline function to do this;
The following is the full code to show a simple map with a line drawn with 4 lines;
<!DOCTYPE html>
<html>
<head>
<title>Simple Leaflet Map</title>
<meta charset="utf-8" />
<link
rel="stylesheet"
href="http://cdn.leafletjs.com/leaflet-0.7/leaflet.css"
/>
</head>
<body>
<div id="map" style="width: 600px; height: 400px"></div>
<script
src="http://cdn.leafletjs.com/leaflet-0.7/leaflet.js">
</script>
<script>
var map = L.map('map').setView([-41.2858, 174.78682], 14);
mapLink =
'<a href="http://openstreetmap.org">OpenStreetMap</a>';
L.tileLayer(
'http://{s}.tile.openstreetmap.org/{z}/{x}/{y}.png', {
attribution: 'Map data © ' + mapLink,
maxZoom: 18,
}).addTo(map);
        var polyline = L.polyline([
            [-41.286, 174.796],
            [-41.281, 174.786],
            [-41.279, 174.776],
            [-41.290, 174.775],
            [-41.292, 174.788]]
            ).addTo(map);
</script>
</body>
</html>
The only difference between this code and the simple map code is the addition of the var polyline = section at the bottom of the JavaScript portion;
var polyline = L.polyline([
[-41.286, 174.796],
[-41.281, 174.786],
[-41.279, 174.776],
[-41.290, 174.775],
[-41.292, 174.788]]
).addTo(map);
Here we are defining a path going from one lat/long point to another. We declare a variable with the L.polyline method and step through our points in the array. Then we simply add that to our map by adding .addTo(map).
And here’s our map complete with path…
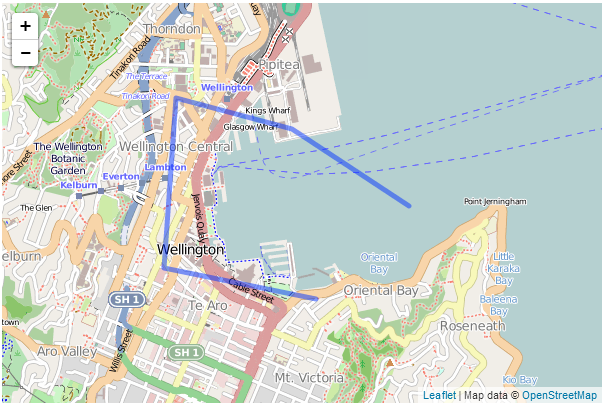
Map with polyline
Obviously this hasn’t been set to follow any logical route :-).
Adding options to our polyline
There are a range of options that can be incorporated into our path and these are added after the array (separated by a comma) and contained in curly braces. The following is an example of the same line but with the colour changed to red, the width (weight) of the line set to 10 pixels, the opacity (transparency) set to 0.7 (on a scale of 0 (transparent) to 1 (opaque)), drawn with dashes of 20 pixels followed by a space of 15 pixels (dashArray) and with rounded corners where the lines join.
        var polyline = L.polyline([
            [-41.286, 174.796],
            [-41.281, 174.786],
            [-41.279, 174.776],
            [-41.290, 174.775],
            [-41.292, 174.788]
            ],
            {
                color: 'red',
                weight: 10,
                opacity: .7,
                dashArray: '20,15',
                lineJoin: 'round'
            }
            ).addTo(map);
And here’s our path with options…
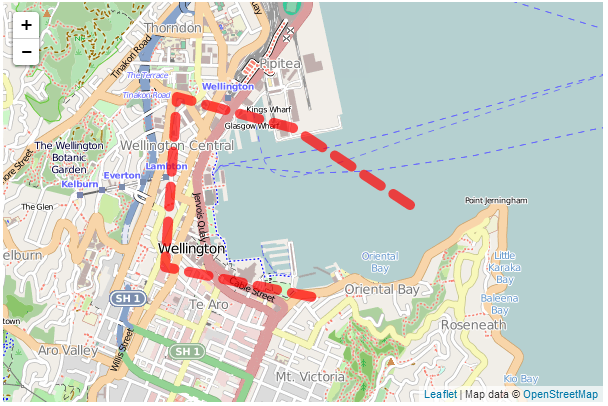
Map with polyline
The full code of a live example of a map incorporating a the polyline and options is available online at bl.ocks.org or GitHub. A copy is also in the appendices and a copy of all the files that appear in the book can be downloaded (in a zip file) when you download the book from Leanpub.
Using multiple tile layers on your map
Leaflet has a great feature that allows you to easily switch between tile layers when viewing your map. It’s built right in to leaflet.js and (as usual) it’s simple to implement.
What we’re going to do is define the locations and appropriate attributions for two different sets of tiles and then tell leaflet to place a control on the map that allows us to switch. These different sets of tiles are referred to as ‘base layers’ and as such only one can be visible at any one time.
The end result is a small icon in the top right hand corner that looks like this…
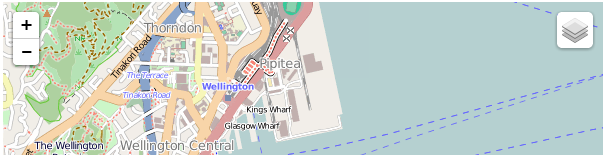
Layers icon
And when we hover over it with our mouse it changes to show the different tile layers that we have defined for use.
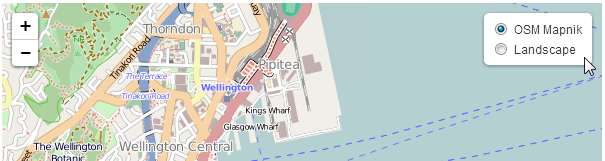
Layers control with mouse over
There is no change to the HTML part of our code from the simple map example. The full code for this example can be found here on GitHub (and there’s a copy in the appendices) and a working example is here on bl.ocks.org. The only change is in the JavaScript portion. and that looks like the following;
var osmLink = '<a href="http://openstreetmap.org">OpenStreetMap</a>',
    thunLink = '<a href="http://thunderforest.com/">Thunderforest</a>';
var osmUrl = 'http://{s}.tile.openstreetmap.org/{z}/{x}/{y}.png',
    osmAttrib = '© ' + osmLink + ' Contributors',
    landUrl = 'http://{s}.tile.thunderforest.com/landscape/{z}/{x}/{y}.png',
    thunAttrib = '© '+osmLink+' Contributors & '+thunLink;
var osmMap = L.tileLayer(osmUrl, {attribution: osmAttrib}),
    landMap = L.tileLayer(landUrl, {attribution: thunAttrib});
var map = L.map('map', {
	    layers: [osmMap] // only add one!
    })
    .setView([-41.2858, 174.78682], 14);
var baseLayers = {
	"OSM Mapnik": osmMap,
	"Landscape": landMap
};
L.control.layers(baseLayers).addTo(map);
(There are a few lines in this printed example which may word wrap, so if you want a version to copy/paste from, I recommend that you use the on-line copy or the copy downloaded in the zip file with the book.)
The first block of code sets up the links that we will use for attribution;
var osmLink = '<a href="http://openstreetmap.org">OpenStreetMap</a>',
thunLink = '<a href="http://thunderforest.com/">Thunderforest</a>';
This just makes it easier to add later when juggling multiple layers.
The we declare the URLs for the tiles and the attributions to display;
var osmUrl = 'http://{s}.tile.openstreetmap.org/{z}/{x}/{y}.png',
osmAttrib = '© ' + osmLink + ' Contributors',
landUrl = 'http://{s}.tile.thunderforest.com/landscape/{z}/{x}/{y}.png',
thunAttrib = '© '+osmLink+' Contributors & '+thunLink;
Again, by declaring these as variables, the process of defining the distinct layers is simplified.
Which is what we do in the next block of code;
var osmMap = L.tileLayer(osmUrl, {attribution: osmAttrib}),
landMap = L.tileLayer(landUrl, {attribution: thunAttrib});
Declaring the layers like this is pretty handy since now we have a single variable for each layer that has all the information associated with it that is required to display the tiles for that layer.
Now we add the map with the following lines of code;
var map = L.map('map', {
layers: [osmMap] // only add one!
})
.setView([-41.2858, 174.78682], 14);
It looks a lot like our simple map example, but in this case we have added in an option called layers and set that to the osmMap layer. This will be the initial layer that is shown on the map/ I have a note there to say that it’s a good idea to only have one of your base layers in there. That’s because if you put more than two it will load both layers when the map first loads and we don’t need to do that unnecessarily.
The second last section of the code declares what our base layers are (there are other sorts of layers, but we’ll get to that later) and gives them appropriate text to display in the layers selection box.
var baseLayers = {
"OSM Mapnik": osmMap,
"Landscape": landMap
};
Then the last line adds the control for the baseLayers to the map
L.control.layers(baseLayers).addTo(map);
As I write this I am seriously considering creating a page and just adding as many layers as I have described in the tile layers section. Hmm… I’ll give that some thought.
As I mentioned earlier, the full code for this example can be found here on GitHub (and there’s a copy in the appendices) and a working example is here on bl.ocks.org.
Overlaying information interactively on your map
In the previous section we described how to declare and switch between more than one tile layer. Tile layers are described as ‘base layers’ in the sense that only one of them will be visible at a time and they will form the ‘base’ of the map.
However, it is obvious that a really useful thing to be able to do would be to add information to our map so that different features or areas can be highlighted. These features or areas will exist on top of the base layer so that they have context. In Leaflet these can be set up as ‘overlays’ where an object or group of elements can be added to a map.
Overlays are treated in much the same way as base layers. In the sense that they are declared and controlled using similar methods but Leaflet is clever enough to recognise that more as many overlays as desired can exist on an individual base layer.
What we aim to do in setting out an example map using an overlay is to add one to our previous base layer switching example. The end result will be the same icon in the top right corner of the map;
Layers icon
But this time when we move our mouse over it, it will present an option to select ‘Interesting places’.
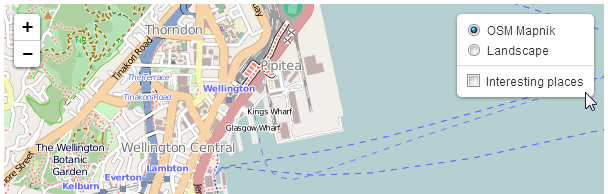
Overlay selection
And when selected it will show a series of markers with a connecting line.
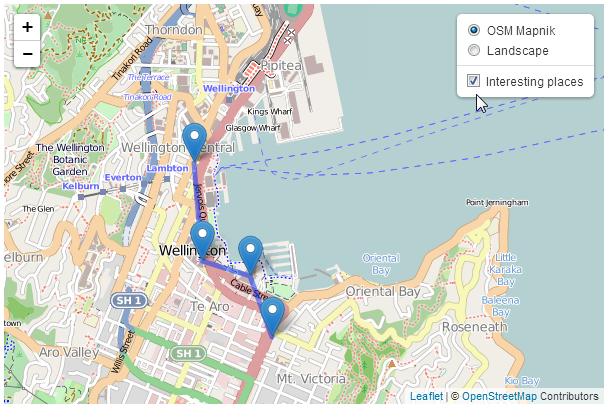
Overlay on a map
As with the base layer switching example, there is no change to the HTML part of our code from the simple map example. The full code for this example can be found here on GitHub (and there’s a copy in the appendices) and a working example is here on bl.ocks.org. The only change is in the JavaScript portion. and that looks like the following;
var coolPlaces = new L.LayerGroup();

L.marker([-41.29042, 174.78219])
    .bindPopup('Te Papa').addTo(coolPlaces),
L.marker([-41.29437, 174.78405])
    .bindPopup('Embassy Theatre').addTo(coolPlaces),
L.marker([-41.2895, 174.77803])
    .bindPopup('Michael Fowler Centre').addTo(coolPlaces),
L.marker([-41.28313, 174.77736])
    .bindPopup('Leuven Belgin Beer Cafe').addTo(coolPlaces),
L.polyline([
    [-41.28313, 174.77736],
    [-41.2895, 174.77803],
    [-41.29042, 174.78219],
    [-41.29437, 174.78405]
    ]
    ).addTo(coolPlaces);
var osmLink = '<a href="http://openstreetmap.org">OpenStreetMap</a>',
thunLink = '<a href="http://thunderforest.com/">Thunderforest</a>';
var osmUrl = 'http://{s}.tile.openstreetmap.org/{z}/{x}/{y}.png',
osmAttrib = '© ' + osmLink + ' Contributors',
landUrl = 'http://{s}.tile.thunderforest.com/landscape/{z}/{x}/{y}.png',
thunAttrib = '© '+osmLink+' Contributors & '+thunLink;
var osmMap = L.tileLayer(osmUrl, {attribution: osmAttrib}),
landMap = L.tileLayer(landUrl, {attribution: thunAttrib});
var map = L.map('map', {
layers: [osmMap] // only add one!
})
.setView([-41.2858, 174.78682], 14);
var baseLayers = {
"OSM Mapnik": osmMap,
"Landscape": landMap
};
var overlays = {
	"Interesting places": coolPlaces
};

L.control.layers(baseLayers,overlays).addTo(map);
(There are a few lines in this printed example which may word wrap, so if you want a version to copy/paste from, I recommend that you use the on-line copy.)
There are only really two differences between this block of script and that for the base layers example.
The first is where we define what our overlay will be made up of.
var coolPlaces = new L.LayerGroup();
L.marker([-41.29042, 174.78219])
.bindPopup('Te Papa').addTo(coolPlaces),
L.marker([-41.29437, 174.78405])
.bindPopup('Embassy Theatre').addTo(coolPlaces),
L.marker([-41.2895, 174.77803])
.bindPopup('Michael Fowler Centre').addTo(coolPlaces),
L.marker([-41.28313, 174.77736])
.bindPopup('Leuven Belgin Beer Cafe').addTo(coolPlaces),
L.polyline([
[-41.28313, 174.77736],
[-41.2895, 174.77803],
[-41.29042, 174.78219],
[-41.29437, 174.78405]
]
).addTo(coolPlaces);
Here we declare a new LayerGroup called coolPlaces (var coolPlaces = new L.LayerGroup();). Then we simply define a set of markers and a polyline (see the earlier sections on these two elements for a fuller description) and add them to our coolPlaces layer.
The second change to our code is right at the end of the block of code.
var overlays = {
"Interesting places": coolPlaces
};
L.control.layers(baseLayers,overlays).addTo(map);
Here we declare our overlays (there is only one (coolPlaces), but you can add as many as you want) using var overlays = {<put overlays here>}. Then we add overlays to our layers control so that it knows to include the layer in the screen widget.
And that’s all there is to it!
As stated earlier, the full code for this example can be found here on GitHub (and there’s a copy in the appendices) an online example is here on bl.ocks.org and there is a copy of all the files that appear in the book that can be downloaded (in a zip file) when you download the book from Leanpub.