Project 4B – Drawing charts on canvas
In this project, we modify previous chapter to draw different types of chart by using the canvas tag and CreateJS library. We will also animate the chart by using the TweenJS, which is part of the CreateJS suite.
Mission Checklist
- Animated bar chart
- Animated tiles
- Pie chart
- Animated pie chart
Preparation
In the chart.coffee, we have following alias declared for easier access to the CreateJS, TweenJS and the Ease library.
1 # alias
2 cjs = createjs
3 Ease = cjs.Ease
4 Tween = cjs.Tween
Animated Bar Chart
There is not much difference in this project and previous project, in terms of app structure and logic flow. The main difference is in the chart.coffee where we draw different type of chart.
- We prepare the structure of
Chartclass.chart.coffee 1this.app?={}23#alias4cjs=createjs5Ease=cjs.Ease67classthis.app.Chart8#Entrypoint.9constructor:(canvasId)->10@stage=newcjs.Stage(canvasId)11cjs.Ticker.setFPS(60);12cjs.Ticker.addEventListener'tick',@stage1314utility.retinalize@stage,false15@canvasWidth=utility.originalCanvasWidth16@canvasHeight=utility.originalCanvasHeight17@initChart()1819initChart:->20@stage.removeAllChildren()21#otherinitchartcodelater2223drawChart:(value,refValue=0)->24#drawthechartcodelater - When we init the chart, we create the rectangle shape and referencing line. They are put into
this(@) scope for thedrawChartto access.chart.coffee 1initChart:->2@stage.removeAllChildren()3margin=545@shape=newRectShape6fillColor:'ORANGERED'7width:@canvasWidth-margin8height:19x:margin10y:@canvasHeight11@stage.addChild@shape12@refLine=newRectShape13fillColor:'RED'14width:@canvasWidth-margin15height:116x:margin17y:@canvasHeight18@stage.addChild@refLine - We have drew the shape in the
initChartmethod. ThedrawChartmethod is actually used to calculate the chart dimension based on the provided value. At last, we animate the shape to the target position and dimension by using TweenJS.chart.coffee 1drawChart:(value,refValue=0)->2areaForEachTile=1003scaleY=value/areaForEachTile4y=@canvasHeight-scaleY5cjs.Tween.get(@shape).to({scaleY,y},400,Ease.quartOut)67refY=@canvasHeight-(refValue/areaForEachTile)8cjs.Tween.get(@refLine).to({y:refY},400,Ease.quartOut)910#Drawoncanvas11@stage.update() - We changed the
drawChartmethod arguments. Now we need the reference value for positioning the reference line. So we update the view logic where it toggles thedrawChartmethod.view.coffee 1this.app.handleListChange=(chart1,chart2)->2#ToggleChart1and23$('input[type="radio"], input[type="checkbox"]').change->4#Chart15value=$('input[type="radio"]:checked').val()6$('.output1').text(Math.round(value))7chart1.drawChart(value)8#Chart29sum=010$('input[type="checkbox"]:checked').each->11sum+=$(this).val()*112$('.output2').text(Math.round(sum))13chart2.drawChart(sum,value)
What just happened?
We used the TweenJS the first time. Here is the syntax:
1 craetejs.Tween.get(anyObject).to({property:newValue, …}, duration, easeFunction)
Animated tiles chart
- Similar to the last example, we prepare the
chart.coffeefile with the basic structure:constructor,initChartanddrawChart.chart.coffee 1classthis.app.Chart2#Entrypoint.3constructor:(canvasId)->4@stage=newcjs.Stage(canvasId)56cjs.Ticker.setFPS(60)7cjs.Ticker.addEventListener'tick',@stage89utility.retinalize@stage,false10@canvasWidth=utility.originalCanvasWidth11@canvasHeight=utility.originalCanvasHeight1213@initChart()14@lastNumberOfTiles=0151617initChart:->18@stage.removeAllChildren()19#Initcodelater202122drawChart:(value)->23#Codelater - The
initChartmethod will draw all the tiles in the canvas area. By default all the tiles has 0 scaling so they are not visible at the beginning.chart.coffee 1initChart:->2@stage.removeAllChildren()3tileWidth=tileHeight=104margin=55leadingMargin=margin+tileWidth/267chartArea=(@canvasWidth-margin-leadingMargin)*(@canvasHeight-margin-leadi\8ngMargin)9tileArea=(tileWidth+margin)*(tileHeight+margin)10@maxNumberOfTiles=Math.floor(chartArea/tileArea)11cols=Math.floor((@canvasWidth-margin)/(tileWidth+margin))1213@shapes=[]14foriin[0...@maxNumberOfTiles]15x=leadingMargin+Math.floor(i%cols)*(tileWidth+margin)16y=leadingMargin+Math.floor(i/cols)*(tileHeight+margin)17shape=newRectShape18fillColor:'ORANGERED'19width:tileWidth20height:tileHeight21x:x22y:y23@stage.addChildshape24@shapes.pushshape2526shape.regX=tileWidth/227shape.regY=tileHeight/228shape.scaleX=shape.scaleY=0 - The
drawChartmethod doesn’t draw the chart. It actually toggle thescaleXandscaleYof the existing tiles. It will scale up or down the tiles based on the given value.chart.coffee 1drawChart:(value)->2#eachtile=100Kkm23areaForEachTile=1004numberOfTiles=Math.floor(value/areaForEachTile)5foriin[0...@maxNumberOfTiles]6ifi<numberOfTiles7delay=(i-@lastNumberOfTiles)*58Tween.get(@shapes[i]).wait(delay).to({scaleX:1,scaleY:1},400,Ease.quar\9tOut)10else11delay=(i-@lastNumberOfTiles)*212Tween.get(@shapes[i]).wait(delay).to({scaleX:0,scaleY:0},400,Ease.quar\13tOut)14@lastNumberOfTiles=numberOfTiles - In the
view.coffee, we ensure the logic to toggle both chart is correct as the following. It is the same as the project 4 code.view.coffee 1this.app.handleListChange=(chart1,chart2)->2#ToggleChart13$('input[type="radio"]').change->4value=$('input[type="radio"]:checked').val()5$('.output1').text(Math.round(value))6chart1.drawChart(value)78#ToggleChart29$('input[type="checkbox"]').change->10sum=011$('input[type="checkbox"]:checked').each->12sum+=$(this).val()*113$('.output2').text(Math.round(sum))14chart2.drawChart(sum)
What just happened?
We have created a nice animated tile-based bar chart.
Static pie chart
- There is only 1 pie chart. We change the HTML to contain 1 chart only.
index.html 1<divclass='charts'>2<canvasid="chart-canvas"width="150"height="150"></canvas>3</div> - We also center align the canvas.
app.css 1#chart-canvas{2display:block;3margin:auto;4} - The pie chart is different from the bar chart we have created.
chart.coffee 1classthis.app.Chart2#Entrypoint.3constructor:(canvasId)->4@stage=newcjs.Stage(canvasId)5cjs.Ticker.setFPS(60);6cjs.Ticker.addEventListener'tick',@stage78utility.retinalize@stage,false9@canvasWidth=utility.originalCanvasWidth10@canvasHeight=utility.originalCanvasHeight11@initChart()12initChart:->13@stage.removeAllChildren()1415drawChart:(leftValue,rightValue)->16x=@canvasWidth/217y=@canvasHeight/218r=501920globalRotation=-90*Math.PI/1802122percentage=rightValue/(leftValue+rightValue)23splitDegree=percentage*3602425#Arc126startAngle=0*Math.PI/180+globalRotation27endAngle=splitDegree*Math.PI/180+globalRotation28shape=newcjs.Shape()29shape.graphics30.beginFill"GOLD"31.moveTo(x,y)32.arc(x,y,r,startAngle,endAngle)33.lineTo(x,y)3435@stage.addChildshape3637#Arc238startAngle=splitDegree*Math.PI/180+globalRotation39endAngle=360*Math.PI/180+globalRotation4041shape=newcjs.Shape()42shape.graphics43.beginFill"ORANGERED"44.moveTo(x,y)45.arc(x,y,r,startAngle,endAngle)46.lineTo(x,y)4748@stage.addChildshape - We changed to 1 chart, so we also change the
handleListChangemethod to toggle the chart with both values form left and right list.view.coffee 1this.app.handleListChange=(chart)->2#ToggleChart3$('input[type="radio"], input[type="checkbox"]').change->4#Left5value=$('input[type="radio"]:checked').val()*16$('.output1').text(Math.round(value))78#Right9sum=010$('input[type="checkbox"]:checked').each->11sum+=$(this).val()*112$('.output2').text(Math.round(sum))1314#UpdateChart15chart.drawChart(value,sum)
Animated pie chart
- The animated chart.
chart.coffee 1classthis.app.Chart2#Entrypoint.3constructor:(canvasId)->4@stage=newcjs.Stage(canvasId)5cjs.Ticker.setFPS(60);6cjs.Ticker.addEventListener'tick',@stage78utility.retinalize@stage9@canvasWidth=utility.originalCanvasWidth10@canvasHeight=utility.originalCanvasHeight11@initChart()12initChart:->13@pieData={14splitDegree:015}1617updateChart:(e)=>18#Codetodrawarcshapelater1920drawChart:(leftValue,rightValue)->21#Codetostarttheshapedrawinglater - In the
updateChartmethod, we clear the stage and draw the arc again based on the currentsplitDegree.chart.coffee 1updateChart:(e)=>2x=@canvasWidth/23y=@canvasHeight/24r=505globalRotation=-90*Math.PI/18067@stage.removeAllChildren()89#Arc110startAngle=0*Math.PI/180+globalRotation11endAngle=@pieData.splitDegree*Math.PI/180+globalRotation12shape=newcjs.Shape()13shape.graphics14.beginFill"GOLD"15.moveTo(x,y)16.arc(x,y,r,startAngle,endAngle)17.lineTo(x,y)1819@stage.addChildshape2021#Arc222startAngle=@pieData.splitDegree*Math.PI/180+globalRotation23endAngle=360*Math.PI/180+globalRotation2425shape=newcjs.Shape()26shape.graphics27.beginFill"ORANGERED"28.moveTo(x,y)29.arc(x,y,r,startAngle,endAngle)30.lineTo(x,y)3132@stage.addChildshape - The
splitDegreevalue is actually changing to create the animated effect.chart.coffee 1drawChart:(leftValue,rightValue)->2percentage=rightValue/(leftValue+rightValue)3splitDegree=percentage*36045Tween.get(@pieData).to({splitDegree},400,Ease.quantOut).addEventListener('c\6hange',@updateChart)
What just happened?
We used the TweenJS to animate the pieData object. TweenJS is an independent library that the target is not necessary to be any CreateJS display object. We can provide any object and ask the TweenJS to tween any numeric property. In the change event, we know the changes happened so we can updated our canvas in our own way. In this example, we create a new pie chart based on the changing value.
Summary
Drawing chart is one of the common canvas usage.
Further challenges
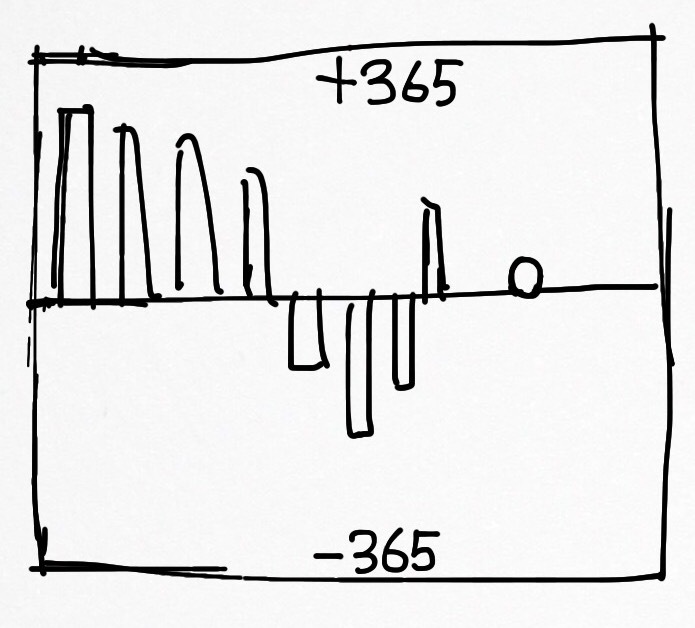
We have discussed the usage of gyroscope sensor in the chapter Rain or Not. What if combine what I have learned there with the chart drawing together? Try creating an inspector as following that shows the value history of the sensor.
You can test the real application by using the following links with your devices.
- Gyroscope Rotation:
http://mztests.herokuapp.com/rotation/ - Accelerometer:
http://mztests.herokuapp.com/motion
Optionally, you may download the app in the Play Store.
https://play.google.com/store/apps/details?id=net.makzan.gyroinspcetor&hl=en
The rotation value ranged from -365 to +365. When we use the following chart, the rotation value shows as a history for better inspection.
Thanks again for reading the book. Hope you enjoy the example projects and learn to build mobile app with the CreateJS library.
If you find any questions, you’re welcome to contact me for any questions. You can find me at:
- Website: makzan.net
- Email: mak@makzan.net
- Twitter: @makzan