Visualizing data with React and d3.js
Welcome to the main part of React+d3.js. We’re going to talk a little theory, some principles, then get our hands dirty with a few examples. Through this book you’re going to build:
- A choropleth map <– need to write
- An interactive histogram <– pretty much have
- An animated alphabet <– already done
- A simple particle generator <– done, should add canvas stuff
- A particle generator pushed to 20,000 elements <– canvas stuff
Looks random, right? Bear with me.
Examples build on each other in complexity. The first teaches you how to make a static data visualization component and shows you an approach to declarative data visualization. The second adds interactivity and components interacting with each other, this teaches you about a simple approach to state management. The third shows you how to use transitions to build simple animations, and the fourth shows you how to do complex animation using a game loop principle.
The fourth example has a fifth example hidden inside where we talk about using canvas with React and pushing the limits. We’re going to animate tens of thousands of elements at the same time, it’s going to be great.
If you like buzzwords, here are the technologies we’re going to use:
- React 15, D3v4, ES6
- React 15, D3v4, ES6, (maybe mobx?)
- React 15, D3v4, ES6
- React 15, D3v4, ES6, Redux
- React 15, D3v4, ES6, Konva, canvas, Redux
Don’t worry, if you’re not comfortable with ES6 syntax yet. By the end of this book you’re gonna love it! In the meantime, here’s a helpful cheatsheet for you: es6cheatsheet.com. It compares the ES5 way with the ES6 way so you can brush up quickly.
I’m working on a similar cheatsheet for D3v3 -> D3v4. You’ll get an email when it’s done.
[^ or maybe just get it done?]
Before we begin the examples, let’s talk about how React and D3 fit together and how we’re going to structure our apps. If you prefer to get your hands dirty first and ask questions later, skip this section and jump to examples.
This section is split into five chapters:
- Basic Approach
- Blackbox Components
- Full Feature Integration
- State Handling Architecture
- Structuring your React App
The basic approach
Our visualizations are going to use SVG - an XML-based image format that lets us describe images in terms of mathematical shapes. For example, the source code of an 800x600 SVG image with a rectangle looks like this:
<svg width="800" height="600">
	<rect width="100" height="200" x="50" y="20" />
</svg>
These four lines create an SVG image with a black rectangle at coordinates (50, 20) that is 100x200 pixels large. Black fill with no borders is default for all SVG shapes.
SVG is perfect for data visualization on the web because it works in all browsers, renders without blurring or artifacts on all screens, and supports animation and user interaction. You can see examples of interaction and animation later in this book.
But SVG can get slow when you have thousands of elements on screen. We’re going to solve that problem by rendering bitmap images with canvas. More on that later.
Another nice feature of SVG is that it’s just a dialect of XML - nested elements describe structure, attributes describe the details. The same principles that HTML uses.
That makes React’s rendering engine particularly suited for SVG. Our 100x200 rectangle from before, looks like this as a React component:
To use this rectangle component in a picture, you’d use a component like this:
<svg width="800" height="600">
<Rectangle />
</svg>
);
You’re right, this looks cumbersome. A lot of work for a static rectangle, right? But look closely, even if you know nothing about React and JSX, you can look at that code and see that it’s a Picture of a Rectangle.
Compare that to a pure D3 approach:
d3.select("svg")
    .attr("width", 800)
		.attr("height", 600)
  .append("rect")
  .attr("width", 100)
  .attr("height", 200)
  .attr("x", 50)
  .attr("y", 20);
It’s elegant, it’s declarative, it looks like function call soup. Even rewriting into a more readable form doesn’t make it much easier to understand the SVG structure at a glance. Observe:
	d3.select("svg")
		.attr({width: 800,
					 height: 600})
	  .append("rect")
	  .attr({width: 100,
				   height: 200,
				   x: 50,
				   y: 20})
That doesn’t scream “Rectangle in an SVG” to me as much as the React example does. You have to take your time and read the code carefully: first we select the svg element, then we add attributes for width and height. After that we append a rect element and set its attributes for width, height, x, and y.
Those 8 lines of code create HTML that looks like this:
<svg width="800" height="600">
	<rect width="100" height="200" x="50" y="20" />
</svig>
Would’ve been easier to just write the HTML right? Yes, for static images you’re better off using Photoshop or similar then exporting to SVG.
Either way, dealing with the DOM is not D3’s strong suit. A lot of typing, code that’s hard to read, slow when you have thousands of elements, and it’s often hard to keep track of which elements you’re changing. D3’s enter-update-exit cycle is great theory, but I personally never found it easy to use.
If you don’t know what I just said, don’t worry, we’ll cover the enter-update-exit cycle in the animations example. Don’t worry about D3 either. I know it’s hard. I’ve written two books about it and I still spend as much time reading the docs as writing the code. There’s a lot to learn, and I’ll explain everything as we go along.
D3’s strong suit is its ability to do everything other than the DOM. There are many statistical functions, great support for data manipulation, and a bunch of built-in data visualizations. D3 can calculate anything for us, all we have to do is draw it out.
Which is why we’re going to follow this approach:
- React owns the DOM
- D3 calculates properties
This way we can leverage React for SVG structure and rendering optimizations, and D3 for all its mathematical and visualization functions.
Now let’s look at two different ways to put them together: blackbox and full-feature.
Blackbox Components
Blackbox components are the simplest way to integrate D3 and React. You can think of them as wrappers around D3 visualizations.
You can take any D3 example from the internets or your brain, wrap it in a thin React component and it Just Works(tm). Yes, we go against what I just said and let D3 control a small part of the DOM tree.
We throw away most of React’s power, but gain a quick way to get things working.
I it the blackbox approach because React’s engine can’t see inside your component, can’t help with rendering, and has no idea what’s going on. From this point onward in the DOM tree you are on your own. Sounds scary, but it’s okay if you’re careful.
Here’s how it works: - React renders an anchor element - D3 hijacks it and puts stuff in
You have to manually re-render on props and state changes. You’re also throwing away and recreating your component’s entire DOM on each re-render.
Manual re-rendering is not as annoying as it sounds, but the inefficiency can get pretty bad with complex visualizations. Use this technique sparingly.
A subtitle?
Let’s build an axis component. We’ll use it in the overall project later.
To make our lives easier, we’re going to use the axis generator that ships with D3. Making our own would take too long.
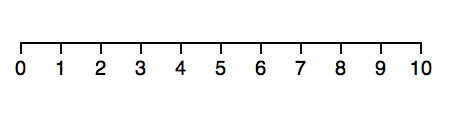
A D3 axis generator takes a scale, some configuration, and renders an axis for us. The code looks like this:
	const scale = d3.scaleLinear()
	                .domain([0, 10])
	                .range([0, 200]);
	const axis = d3.axisBottom(scale);

	d3.select('svg')
	  .append('g')
	  .attr('transform', 'translate(10, 30)')
	  .call(axis);
If that doesn’t make any sense, don’t worry. There’s a lot of D3 to learn and I’ll help you out. If it’s obvious, even better! You’re a pro and this book will be a much quicker read.
We start with a linear scale that has a domain [0, 10] and a range [0, 200]. You can think of scales as mathematical functions that map a domain to a range. In this case calling scale(0) returns 0, scale(5) returns 100, scale(10) returns 200. Just like middle school mathematics.
We create an axis generator with axisBottom, which takes a scale and is going to generate a bottom oriented axis – numbers below the line. You can also tweak settings for number of ticks, their sizing, and spacing.
Equipped with an axis generator, we select the svg element, append a grouping element, use a transform attribute to move it 10px to the right and 30px down, and invoke the generator with .call().
It creates a small axis:
You can play around with this example on CodePen, here. Try changing the scale type.
Another subtitle?
Now let’s say we want to use that same axis code, but as a React component. The simplest way is to use a blackbox component approach. Like this:
class Axis extends Component {
  componentDidMount() { this.renderAxis() }
  componentDidUpdate() { this.renderAxis() }

  renderAxis() {
    const scale = d3.scaleLinear()
                    .domain([0, 10])
                    .range([0, 200]);
    const axis = d3.axisBottom(scale);

    d3.select(this.refs.g)
      .call(axis);
  }

  render() {
    return <g transform="translate(10, 30)" ref="g" />
  }
}
Oh man so much code! Is this really worth it? Yes, for the other benefits of using React in your dataviz. You’ll see :)
We created an Axis component that extends React base Component class. We can’t use functional stateless components for this because we need lifecycle hooks. More on those later.
Our component has a render method, which returns a grouping element, g, moved 10px to the right and 30px down using the transform attribute. Same as before.
We added a ref attribute, which lets us reference elements in our component via this.refs. This makes D3 integration cleaner and probably work with React-native. I haven’t tried yet.
The body of renderAxis should look familiar. It’s where we put code from the pure D3 example. Scale, axis, select, call. No need to append a grouping element, we’re already there with this.refs.g.
For the manual re-rendering part, we call renderAxis in componentDidUpdate and componentDidMount. This ensures that our axis re-renders every time React’s engine decides to render our component. On state and prop changes usually.
That wasn’t so bad was it? You can try it out on CodePen, here.
To make our axis more useful, we could get the scale and axis orientation from props. We’ll do that for scales in our bigger project.
Full-feature Integration
As useful as blackbox components are, we need something better, if we want to leverage React’s rendering engine. We’re going to look at full-feature integration where React does the rendering, and D3 calculates the props.
To do that, we’re going to follow a 3-part pattern:
- set up D3 objects as class properties
- update D3 objects when component updates
- output SVG in render()
It’s easiest to show you with an example. Let’s build a rectangle that changes color based on input values. We’re going to render a couple of them to make a color scale.
Yes, it looks like a trivial example, but color-as-information is an important concept in data visualization. We’re going to use it later to build a choropleth map of household income in the US.
I suggest following along in Codepen for now. Here’s one I set up for you. It contains the final solution, so you can follow along and nod your head. I’ll explain each part.
You must be itching to use the environment you set up with create-react-app. That comes later. When we do the real-er dataviz project :)
We start with a Swatch component that draws a rectangle and fills it with a color.
const Swatch = ({ color, width, x }) => (
  <rect width={width}
			  height="20"
			  x={x}
			  y="0"
			  style={{fill: color}} />
);
Looks like our earlier components doesn’t it? It’s exactly the same, a functional stateless component that draws a rect element with some attributes - dimensions, position, and fill style.
Note that style is a dictionary so we specify it with double curly braces. Outer braces denote a dynamic value, inner braces denote a dictionary.
Then we need a Colors component. It follows the full-featured integration structure: D3 objects as properties, an updateD3 function, plus some wiring for updates and rendering.
class Colors extends Component {
  colors = d3.schemeCategory20;
  width = d3.scaleBand()
            .domain(d3.range(20));
We start by inheriting from Component, and defining defaults for D3 objects. this.colors is one of D3’s predefined color scales. schemeCategory20 is a scale of 20 colors designed for categorization. Seemed like a good example, and you’re welcome to try others.
this.width is a D3 scale designed for producing bands, d3.scaleBand. As mentioned earlier, scales map domains to ranges. We know our domain is 20 colors, so we can statically set the domain as [1, 2, 3, ..., 20] with d3.range(20).
d3.range generates a counting array, by the way. We’ll use that a lot.
We’ll use this.width to calculate widths and positions of our color swatches. Here’s a picture from D3 docs to help you visualize what scaleBand does:

Unlike the domain, our range is dynamic so that we can define the width of our color scale in props. This makes the component more reusable.
componentWillMount and componentWillUpdate are component lifecycle hooks. Can you guess when they run?
The former runs just before React’s engine inserts our component into the DOM, and the latter just before React updates it. That happens on any prop change or setState call.
Both of them call our updateD3 component with the new value of props. We use it to update the range of our this.width scale. This ensures our component listens to prop and state changes like any other, while ensuring the internal state of D3 objects is kept up to date.
Finally, we render a bunch of color swatches.
<g>
{d3.range(20).map(i => (
<Swatch color={this.colors[i]}
width={this.width.step()}
x={this.width(i)} />
))}
</g>
)
}
}
We create a grouping element to fulfill React’s one child per component requirement, then render 20 swatches in a loop. Each gets a color from this.colors, and a width and x from this.width.
After inserting into the DOM with ReactDOM, we get a series of 20 colorful rectangles.
Try changing the width="400" property of <Colors />. You’ll see D3’s scaleBand and our update wiring ensure the color strip renders correctly. For more fun, try changing the Colors component so it takes the color scale as a prop, then rendering multiple instances of <Colors /> side-by-side.
Here’s the playground again: CodePen
State Handling Architecture
You know all about making simple components with D3 and React. You’re well on your way to building great things! 🙌ðŸ�¼
Before I can set you loose on the world, we should talk about managing state. It’s where most developers shoot themselves in the foot.
Believe me, I know. I’ve shot myself in the foot a lot. Life gets harder and harder until one day you want to throw all your code away and embark on The Rewrite. That’s how projects die.
The Rewrite killed Netscape. You probably don’t even remember Netscape 😉
Let’s save you from that.
For most of the book, we’re going to use a unidirectional dataflow architecture inspired by Flux:
- The Main Component is the repository of truth
- Child components react to user events
- They announce changes using callbacks
- The Main Component updates its truth
- The real changes flow back down the chain to update UI
This might look roundabout, but I promise, it’s awesome. It’s better than worrying about parts of the UI going out of date with the rest of the app. I could talk your ear off with debugging horror stories, but I’m nice, so I won’t.
Having your components rely just on their properties is like having functions that rely just on their arguments. Given the same arguments, they always render the same output.
Functional programming for HTML! 😎
Granted, our approach is less flexible and scalable than using Redux or MobX, but avoiding an extra library makes it easier to explain. With Redux or MobX, you’d use a data store in place of main component state as your source of truth, and actions in place of callbacks traversing the component tree.
If you don’t know about Redux or MobX, don’t worry. I mention them here to make your Googling easier and to give you an idea of how our approach compares. I’ll explain Redux in more detail in the Animating with React, Redux, and d3 chapter, and MobX in the MobX chapter.
The functional programming concepts we’re relying on are called referential transparency, idempotent functions, and functional purity. I suggest googling them, if you like to understand the theory behind things.
Structuring your React app
As you can guess from the architecture chapter, we’re going to structure our app into components. Deciding what to put into one component and what into another is one of the hardest problems in engineering.
Entire books have been written on the topic, so here’s a rule of thumb that I like to use: If you have to use the word “and” to describe what your component does, then it should become two components.
Once you have those two components, you can either make them child components of a bigger component, or you can make them separate. The choice depends on their re-usability.
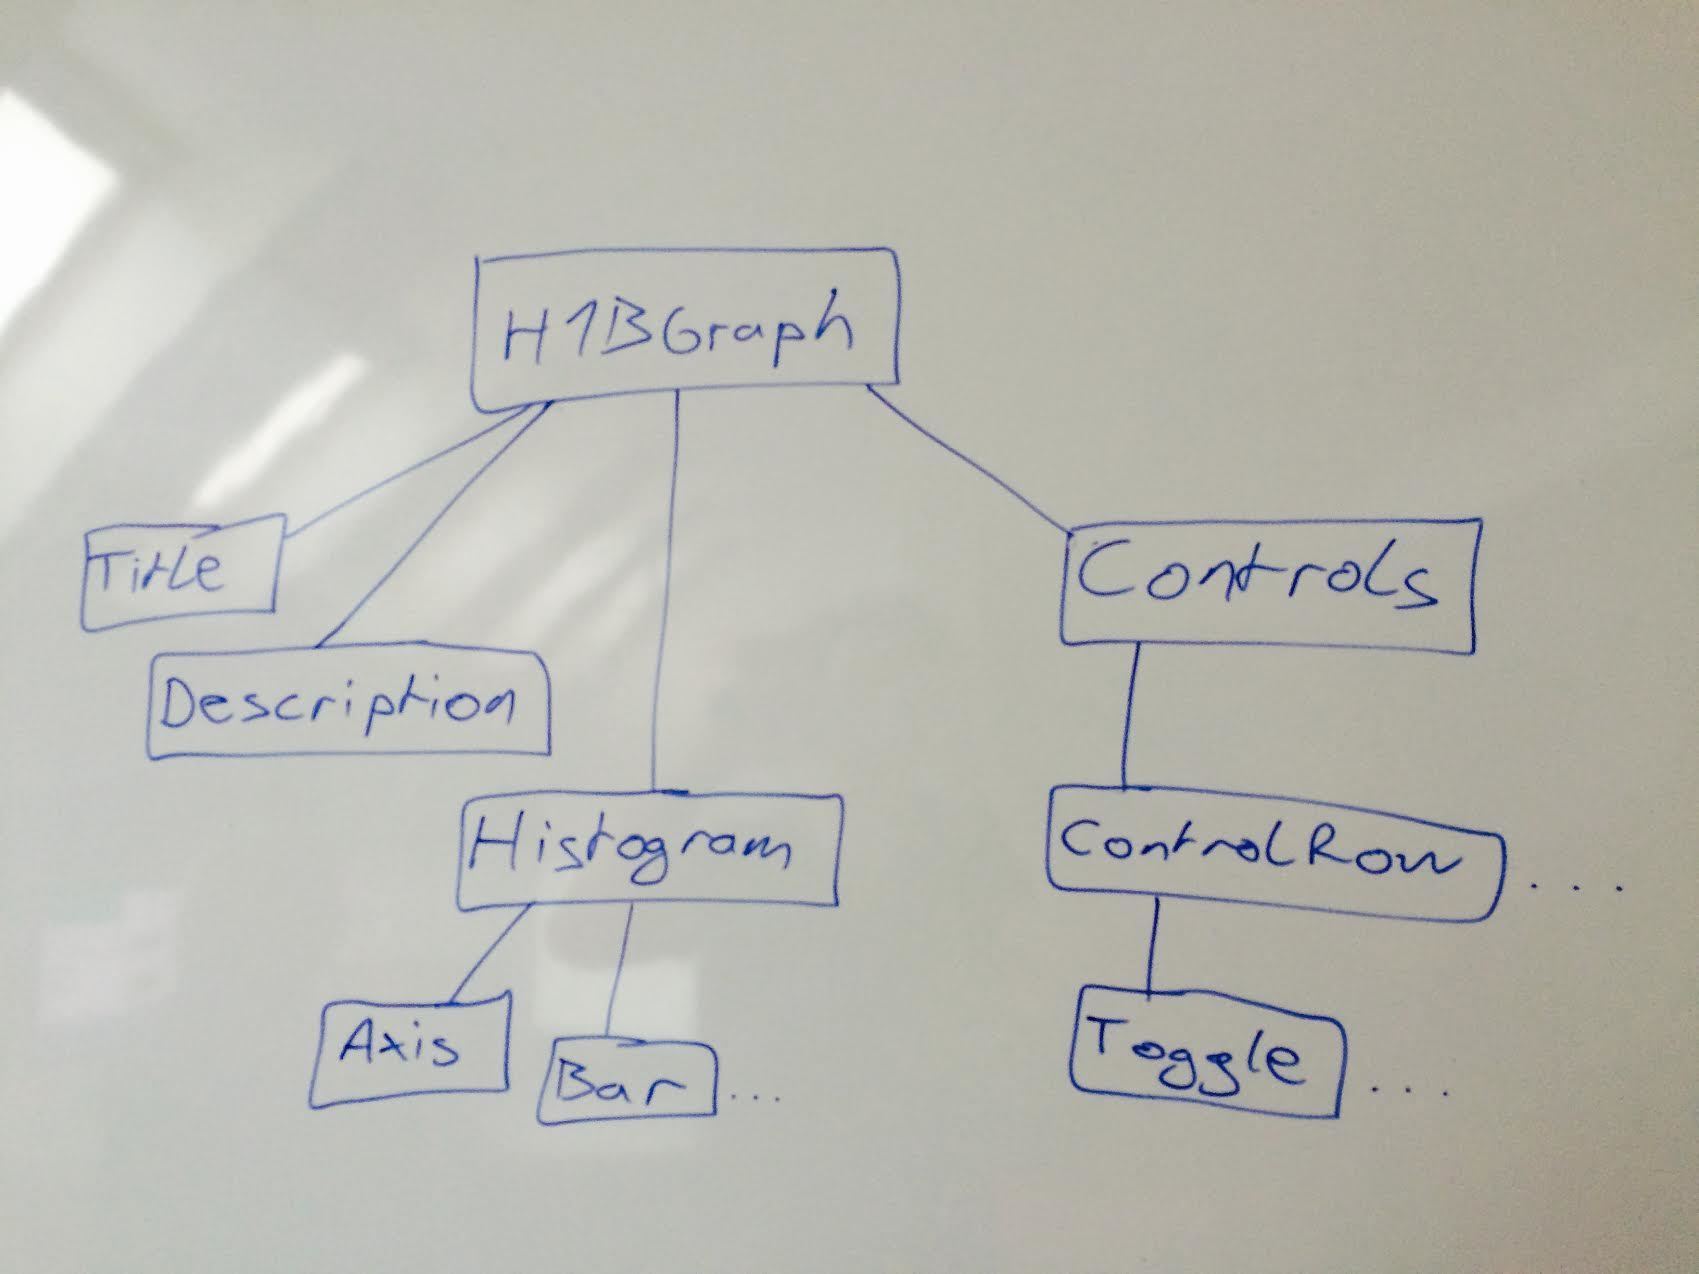
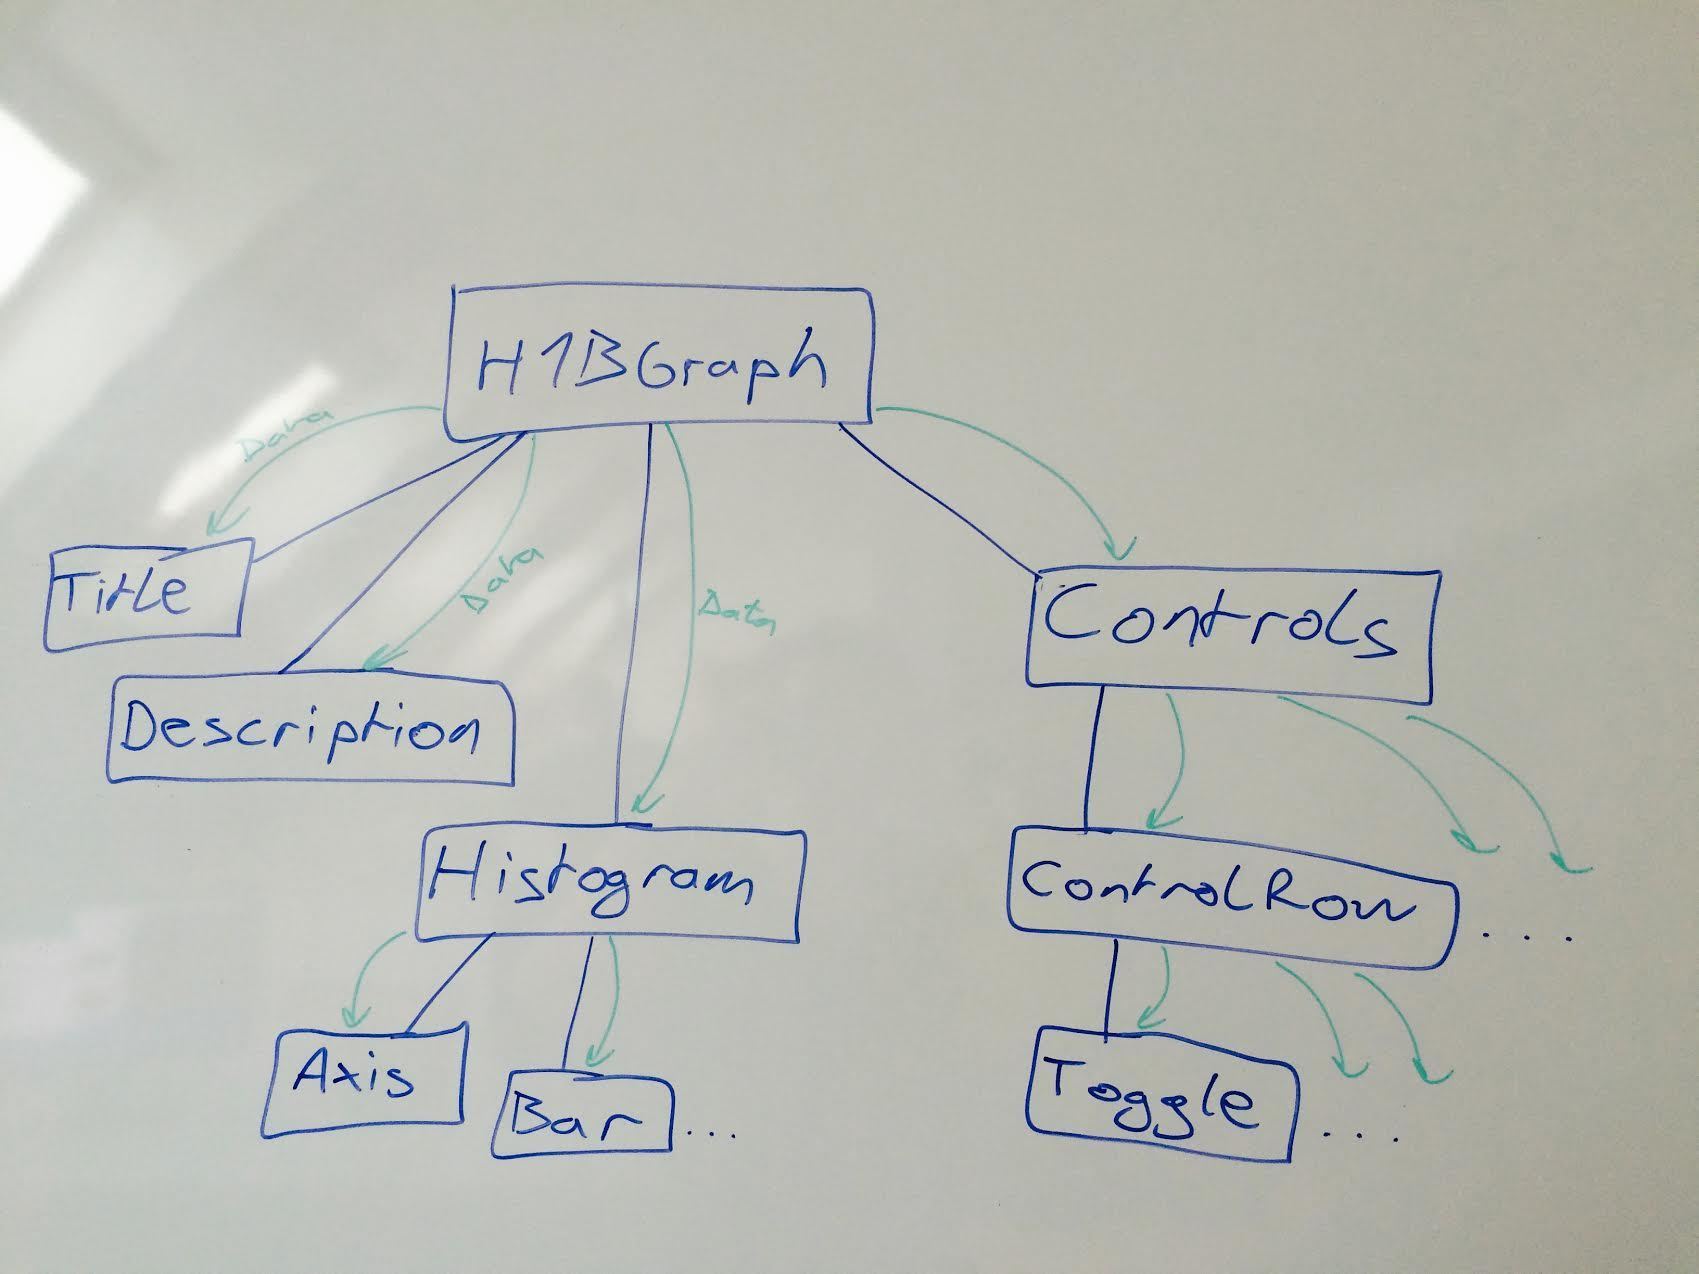
For instance, to build our US work visa visualization, we are going to build three top-level components:
- App, which handles the entire UI
- Histogram, which is a passive component for rendering labeled histograms
- Choropleth, which is a passive component for rendering choropleth maps
Histogram and Choropleth are going to be children of App in the final hierarchy, but we might use it somewhere else. That makes it a good candidate for a stand-alone component.
Other components such as the mean value dotted line, filter controls, and title/description meta components are specific to this use-case. We’ll build them as child components of H1BGraph. Building them as separate components makes them easier to reason about, reusable locally within H1BGraph, and easier to write tests for.
[^ figure this shit out for real]
We’re not going to write tests here, though. That’s a topic for another book. Right now, we’re going to focus on React and D3.
Each component will have its own folder inside src/components/, or its parent component, and at least an index.js file. Some will have style definitions, child components, and other JavaScript files as well.
In theory, each component should be accessible with import My Component from './MyComponent', and rendered with <MyComponent {...params} />. If a parent component has to know details about the implementation of a child component, something is wrong.
You can read more about these ideas by Googling “leaky abstractions”, “single responsibility principle”, “separation of concerns”, and “structured programming”. Books from the late 90’s and early 2000’s (when object oriented programming was The Future (tm)) are the best source of [curated] info in my experience.
Congratz! You know everything you need to build visualizations with React and D3. �
Personally this is the point in tech books where I run off and start building things on my own. Then I get frustrated when something doesn’t fit, spend hours Googling for answers, and remember that hey maybe I should read the rest of the book!
Reading the rest of the book helps. I’ll show you how all this stuff fits together into a larger project 😊
We’re going to build this:
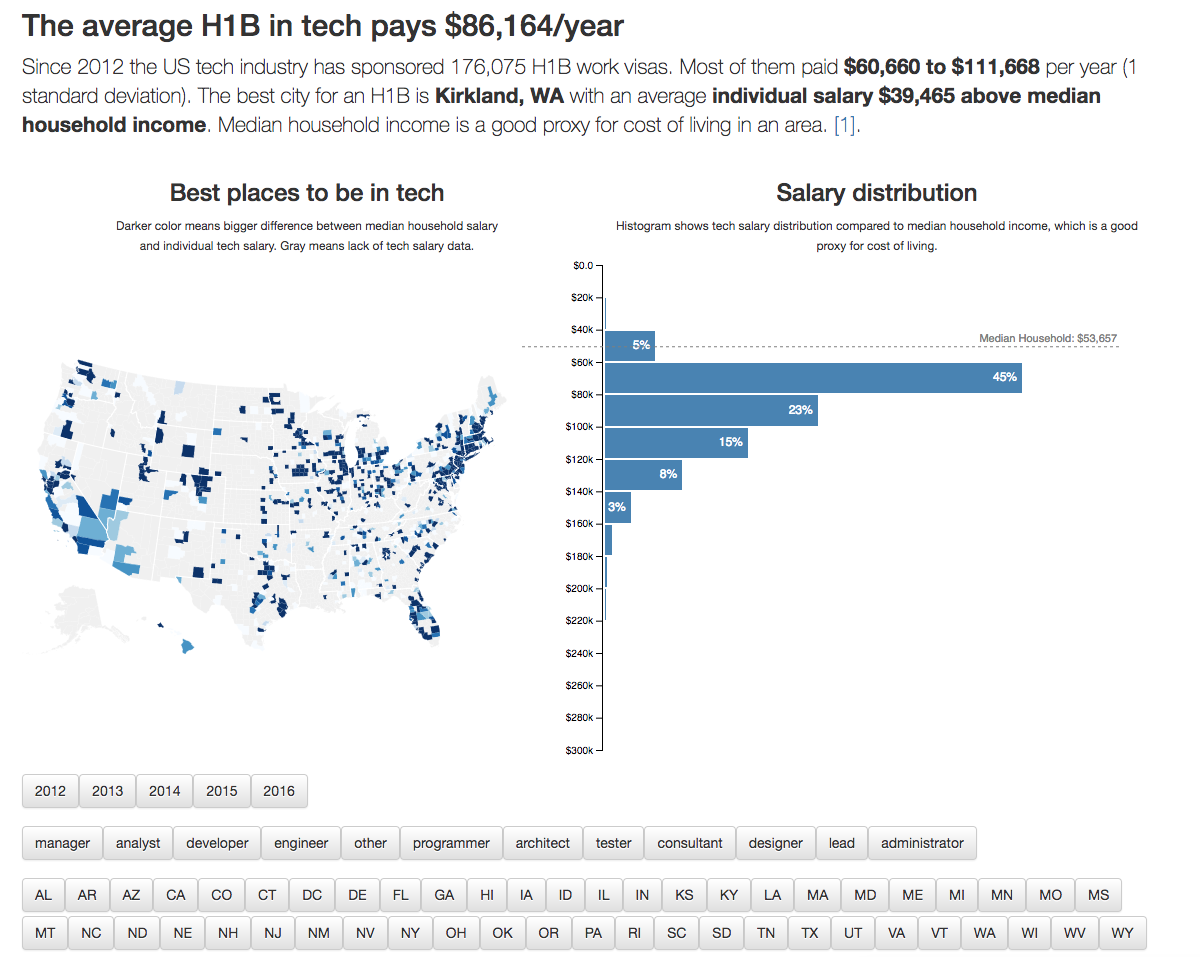
An interactive visualization app with a choropleth map and a histogram comparing tech salaries with median household income in the area.
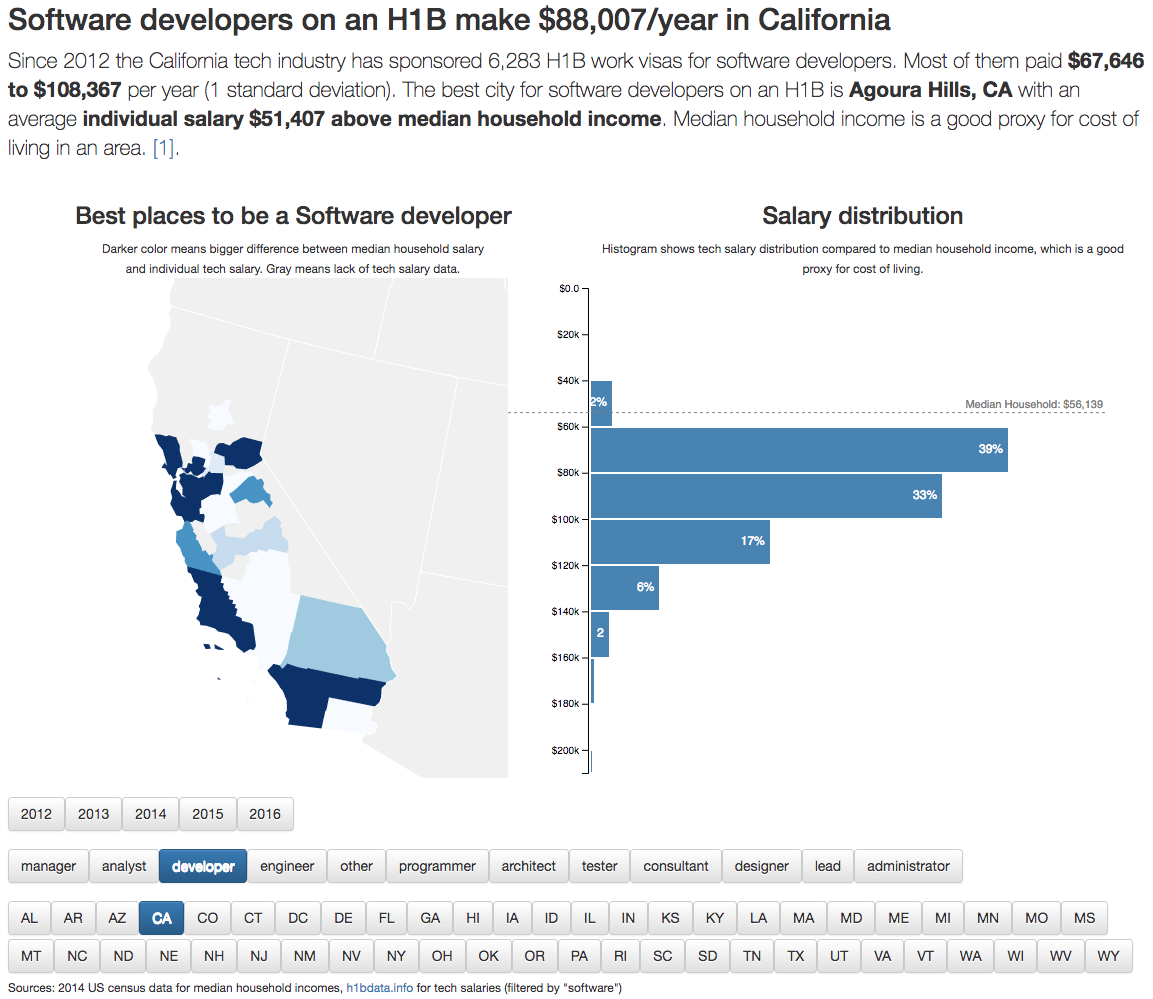
It’s going to be great.
[^ maybe place this somewhere earlier too?]