Chapter 10. Management and monitoring
As a system or cluster grows, you may start getting hardware or virtual machine failures in your cloud/dedicated infrastructure. In such cases, you may need to do one of these things: add/remove nodes from the cluster or backup/repair nodes. These tasks come as an integral part of a system administrator daily work. Luckily all these tasks are relatively straightforward in Apache Ignite and partially documented in Ignite documentation.
In the last chapter of this book, we will go through Ignite’s built-in and 3rd party tools to manage and monitor the Ignite cluster in the production environment. We divided the entire chapter into two parts: management and monitoring. In the management part, we will discuss different tools and technics to configure and manage the Ignite cluster. And we will cover the basic of monitoring Apache Ignite includes logging, inspection of JVM, etc. in the monitoring part.
Managing Ignite cluster
Out-of-the-box Apache Ignite provides several tools for managing cluster. These tools include web interface or command line interface that allows you to perform various task such as start/stop/restart remote nodes or control cluster states (baseline topology). A table below shows all the built-in tools of the Apache Ignite to configure and managing Ignite cluster.
| Name | Description |
|---|---|
| Ignite Web console | Allows configuring all the cluster properties, and managing the Ignite cluster through a web interface. |
| Control script | A command line script that allows to monitor and control cluster states includes Ignite baseline topology. |

Monitoring Ignite cluster
At this point, your Ignite cluster is configured and running. Applications are using the Ignite cluster for writing and reading data to and from it. However, Ignite is not a set-it-and-forget-it system. Ignite is a JVM based system and designed to fast fail. So, it requires monitoring for acting on time.
Ignite is built on JVM and JVM can use the JMX or Java Management Extension. In other words, you can manage the system remotely by using JMX, gathering metrics (cache or memory) including the memory, CPU, threads, or any other part of the system that has been instrumented in JMX. Instrumentation enables the application or system to provide application-specific information to be collected by the external tools.
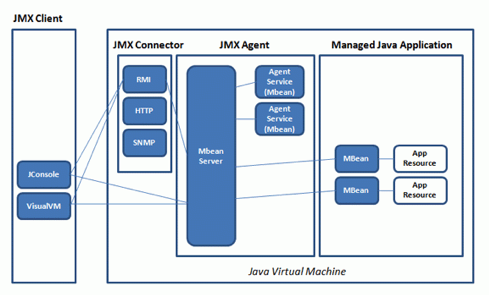
MBeans or Managed Beans are a particular type of JavaBeans that takes a resource inside the application or the JVM available externally. Figure 10.7 shows a high-level architecture of the JMX.
Apache Ignite provides a few JMX MBeans for collection and monitoring cache and memory metrics as follows:
- CacheMetricsMXBean. MBean that provides access to cache descriptor.
- CacheGroupMetricsMXBean. MBean that provides metrics for caches associated with a particular CacheGroup.
- DataRegionMetricsMXBean. MBean that provides access to DataRegionMetrics of a local Apache Ignite node.
- DataStorageMetricsMXBean. An MBean allowing to monitor and tune persistence metrics.
A few more new MBeans will be added in the subsequent Apache Ignite releases soon.
The standard tools that ships with Java for managing the MBeans is JConsole or VisualVM. In the case of VisualVM you have to install the VisualVM-MBeans plugin. VisualVM is like JConsole but with more advanced monitoring featuring such as CPU profiling and GC visualization.
VisualVM
VisualVM is a GUI tool for monitor JVM. It helps the application developers and architects to track memory leaks, analyze the heap data, monitor the JVM garbage collector and CPU profiling. Moreover, after installing the VisualVM-MBeans plugin, you can manage and collect metrics from JMX MBeans provides by the application. VisualVM can be also used for monitoring the local and the remote Java process as well.
As we stated before, for monitoring the Ignite process you can lunch VisualVM with two different ways:
- Use ignitevisor
VVMcommand to open a VisualVM instance or - lunch a VisualVM instance manually by the
jVisualVM.exe|shfrom the$JAVA_HOME/binfolder.
IgniteVisor VVM command under the cover uses the default JDK installation to run the local VisualVM tool. Let’s execute an Ignite node, create a table and populate some test data into the table. I am going to use the EMP table and data from the previous section. If you are having any trouble to create the table, please refer to step 5 of the previous section.
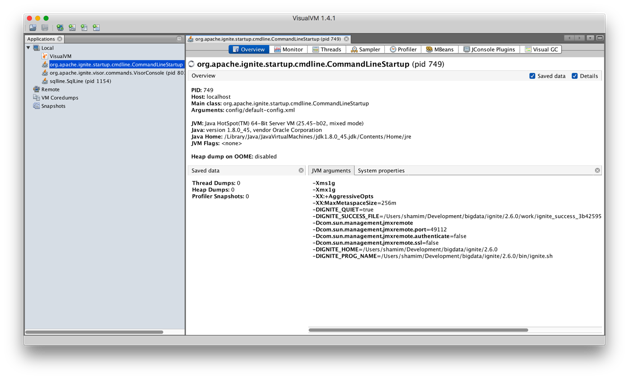
Step 1. Lunch the VisualVM application from the JDK bin directory. On top-left corner of the application tab, you can see different options like Local, Remote and Snapshots. Select the org.apache.ignite.startup.cmdline.CommandLineStartup application from the Local section as shown below.
By default when Ignite node is started with ignite.sh!bat script, it picks up a random JMX port and binds to it. You can explicitly set the JMX port by setting the IGNITE_JMX_PORT environmental variable. In *nix system it can be done in the following way:
export IGNITE_JMX_PORT=55555
However, if you run the Ignite node programmatically (i.e., by using Eclipse/IntelliJ IDEA), then the environmental variable IGNITE_JMX_PORT will not work. In such a situation, you need to pass the system parameters to your Java process that calls Ignition.start as follows:
-Dcom.sun.management.jmxremote -Dcom.sun.management.jmxremote.port={PREFERRED_PORT}
-Dcom.sun.management.jmxremote.authenticate=false -Dcom.sun.management.jmxremote.ssl=fals\
e
Step 2. The Memory, anf Threads tabs are sets of graphs that provide insight into the current state of the application. The monitor tab consists of graphs about the current state of the Java heap, CPU, Classes and threads (see Figure 10.8).
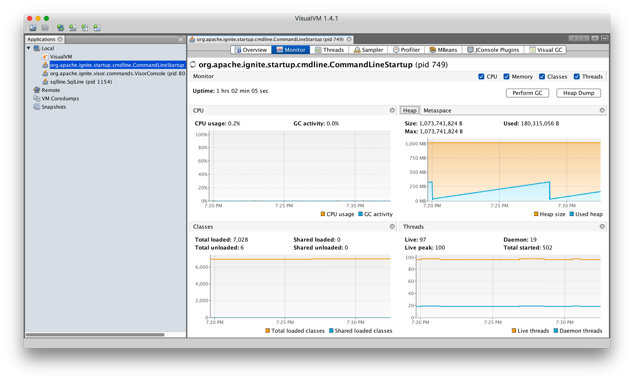
The Classes graph is merely a graph of how many classes are loaded into the JVM at the current time. One of the most important metrics to be aware of is your current heap usage. Ignite uses off-heap memory to store data from version 2.0 by default, so it is unnecessary to use a large heap size for Ignite node. By using small heap size, you reduce the memory footprint on the system and possibly speed up the GC process.
Step 3. Let’s open the tab MBeans. There are many MBeans that are useful for assessing the state of the Ignite node. You will notice that there are few grouping here that can be expanded. All the Ignite MBeans classpath starts with the org.apache. Expand the group Cache Group under 18b4aac2 and click on the EMPcache MBean as shown in figure 10.10.
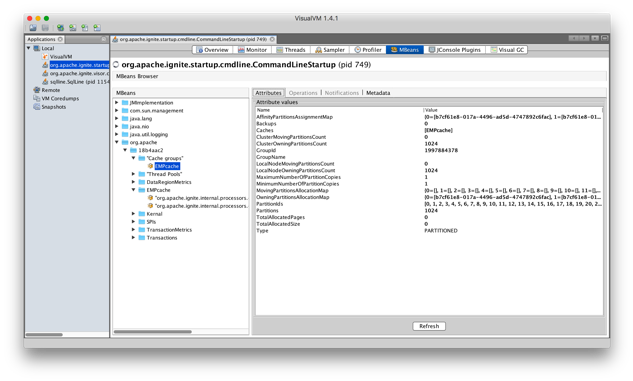
You should notice many import attributes shown for the EMPcache cache. Click on the value of the LocalNodeOwningPartitionsCount attribute, and a simple chart should pop up and show the current total number of partitions for the cache.
When you select an MBean in the tree, its MBeanInfo and MBean descriptor are displayed on the right-hand side of the window. If any additional attributes, operations or notifications are available, they appear in the tree as well below the selected MBean. As a high-level overview, they are broken down into the following categories:
- Cache Groups. The MBeans stored in this section cover everything about the actual data storage part of Ignite. This MBeans provides information about the caches itself: Affinity partitions assignment map, total backups, collections of the partitions as well as total partition number.
- Kernel. In the Kernel section, some MBeans cover the basic information about the node. For example, IgniteKernel MBean provides you the information about node Uptime, local node id or Peer class loading option.
- SPIs. The MBeans in the SPI’s section covers the information about node discovery and internode communication. These include informations such as Node fails, Network timeout.
- TransactionMetrics. The metrics available in this section are closely related to transactions. These are things like LockedKeysNumber, TransactionRollbackNumber.
Each one of these sections of MBeans provides access to a large amount of information, giving you insight into both the system as a whole and the individual nodes. There is no need to cover all of them as you can easily explore them on your own using VisualVm GUI interface.
Using JConsole/VisualVM to monitor a local application or Ignite node is useful for development or prototyping. Monitoring an Ignite cluster over 5 nodes by VisualVM or JConsole is unrealistic and time-consuming. Also, JMX does not provide any historical data. So, it is not recommended for production environments. Nowadays there is a lot of tools/software available for system monitoring. Most famous of them are:
In the next sub-section, we cover the Grafana for monitoring Ignite node and provide step-by-step instructions to install and configure the entire stack technology.
Grafana
Grafana is an open-source graphical tool dedicated to query, visualize and alert on for all your metrics. It brings your metrics together and lets you create graphs and dashboards based on data from various sources. Also, you can use Grafana to display data from different monitoring systems like Zabbix. It is lightweight, easy to install, easy configure, and it looks beautiful.
Before we dive into the details, let’s discuss the concept of monitoring large-scale production environments. Figure 10.11 illustrated a high-level overview of how the monitoring system looks like on production environments.
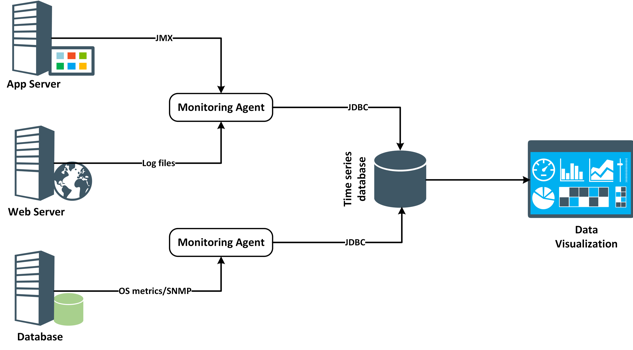
In the above architecture, data such as OS metrics, log files, and application metrics are gathering from various hosts through different protocols likes JMX, SNMP into a single time-series database. Next, all the gathered data is used to display on a dashboard for real-time monitoring. However, a monitoring system could be complicated and vary in different environments, but the basic is the same for all.
Let’s start at the bottom of the monitoring chain and work our way up. To avoid a complete lesson on monitoring, we will only cover the basics along with what the most common checks should be done as they relate to Ignite and it’s operation. The data we are planning to use for monitoring are:
- Ignite node Java Heap.
- Ignite cluster topology version.
- Amount of server or client nodes in cluster.
- Ignite node total up time.
The sample chapters are ends here. If you are not sure if this book is for you, I encourage you to try it out, and if you don’t like the book, you can always ask a 100% refund within 45 days.