1. The Map and the View
Among all the elements in the OpenLayers3 puzzle, the map is probably the main piece, so it is natural to start introducing to OpenLayers3 describing how to work with it.
Contrary to previous versions, OpenLayers3 differentiates between the concept of map, which takes care of layers, controls, overlays, etc and the way we visualize it, which is done by the view. The view is like a window through which we see the map. It allows to change the location we are looking at, go closer or farther.
The concept of view allows us to make things like render the same map in different views (centered at different places), render the same map in a 2D view and in a 3D one, or render different maps using the same view.

|
The goal of OpenLayers3 is to offer two implementations of the view: 2D and 3D. Unfortunately, when I write this lines, only a 2D view implementation is available but there are plans for creating a 3D view based on the Cesium project. |
1.1 The Map
The ol.Map is the class that allows to handle the concept of map in our application. We can add or remove layers, controls, overlays and interactions.
On its simplest form, creating a new ol.Map instance requires the user specifies an object with the next properties:
-
target, the target HTML element (a DOM node), where the map will be rendered -
layers, one or more layer references with the data to be shown -
view, anol.Viewinstance responsible to manage the way to visualize the map.
A basic map
So, given the next DOM element, that will act as the target:
1 <div id="map" class="map"></div>
That uses the next style to set its dimensions:
1     .map {
2         width: 600px;
3         height: 400px;
4     }
A basic map can be easily created with the next code:
 1     var map = new ol.Map({
 2         target: 'map',
 3         layers: [
 4             new ol.layer.Tile({
 5                 source: new ol.source.OSM()
 6             })
 7         ],
 8         view: new ol.View({
 9             center: ol.proj.transform([2.1833, 41.3833], 'EPSG:4326', 'EPSG:3857\
10 '),
11             zoom: 6
12         })
13     });
The target can be a string with the element identifier or a reference to the element itself, for example, retrieving it using document.getElementById('map'). The map will be created within the target element and will fill it completely. The target allows to layout or style the map within the web page.
The layers array must contain instances of layers, defined at the ol.layer namespace. In the sample, we are using a tile based layer that uses OpenStreetMap project as data source. Don’t worry about the code related to layers at this point, we will cover it in detail in next chapters.
Finally, the view instance we are passing is a 2D view initialized at zoom level 6 and centered near Barcelona city. As the ol.source.OSM source uses the projection EPSG:3857, the center of the view must be set in the same projection and, because the center is specified in EPSG:4326, we must transform it to be in EPSG:3857.
|
|
Explain map projections is out of the scope of this book. We only cover how to make a few transformations to work with data in OpenLayers3. |
It is worth to say that, by default, if no controls are specified when a map instance is created it is automatically initialized with the controls: attribution, logo and zoom (which we will cover in next chapters).
1.1.1 Map properties and methods
Although we usually initialize a map using the previous properties, the ol.Map class uses internally only four properties: the target, the layergroup, the view and size.
The target and the view were described in previous sections, while the size contains an array with the map size in pixels.
The layergroup property is a reference to a ol.layer.Group instance, which stores the references to the layers of the map. Thus, the initial set of layers we specify in the layers property at initialization time are stored in the layergroup.

|
We will discuss in depth the |
The ol.Map class offers methods to get and set its properties in addition to methods needed to work with layers, controls, etc. In this section we will cover the most basic ones while we will see the rest in next chapters.
All the map properties has its corresponding getter and setter methods: getTarget, setTarget, getView, setView, getSize, setSize, getLayerGroup and setLayerGroup.
1     var size = map.getSize();   // [x,y] pixel size
2     var view = map.getView();
In addition to the getLayerGroup, which returns a ol.layer.Group reference, the map offer the getLayers method which returns an array with the layers of the map:
1     var group = map.getLayerGroup();   // ol.layer.Group instance
2     var layers = map.getLayers();        // [layerA, layerB, ...]
|
|
Read the Controlling the layer stack section on Layers chapter to learn more about the difference of |
1.1.2 What really happens when a map is created
When an ol.Map instance is created on a target DOM element, OpenLayers3 creates a new div element within the target, called the viewport, that is the real location where the map, the controls or the overlays are placed.
As example, next we show the code created for a DOM based map on a target domMap element:
 1     <div id="domMap" class="map">
 2         <div class="ol-viewport" style="position: relative; overflow: hidden; wi\
 3 dth: 100%; height: 100%;">
 4             <div class="ol-unselectable" style="position: absolute; width: 100%;\
 5  height: 100%;">...</div>
 6         </div>
 7         <div class="ol-overlaycontainer"></div>
 8         <div class="ol-overlaycontainer-stopevent">
 9             <div class="ol-attribution ol-unselectable">...</div>
10             <div class="ol-logo ol-unselectable">...</div>
11             <div class="ol-zoom ol-unselectable">...</div>
12         </div>
13     </div>
If for any reason you will need access to this element you can obtain a reference from the map instance with the getViewport method.
1     var map = new ol.Map({
2         target: "domMap",
3         ...
4     });
5
6     var viewport = map.getViewport();
1.1.3 Different ways to render the map
OpenLayers3 comes with the ability to render the maps using three different technologies: DOM, canvas and WebGL.
Using DOM renderer, all map elements are drawn using HTML elements, for example using img for tiles or svg for features. With canvas, the maps are rendered using the HTML5 canvas element, which offers an scriptable way to render 2D shapes and bitmap images. Finally, WebGL renders the map using the WebGL technology, a subset of OpenGL standard suitable for browsers and that allows to take advantage of the GPU power.
You can force the map to use a specific renderer using the renderer property. It accepts a single value, within the list canvas, webgl or dom, or an array of values that determines the order elements will try to be rendered.
1     var domMap = new ol.Map({
2         ...
3         renderer: 'canvas'
4         ...
5     });
By default, if none of the previous properties are specified, OpenLayers3 sets the renderer property to the next hints ['canvas', 'dom', 'webgl']. This means when a new map instance is created OpenLayers3 tries to use the Canvas renderer if it is supported by the browser, otherwise tries to use the DOM mechanism and, finally, if neither is supported uses the WebGL technology.
|
|
Take into account DOM mechanism has the worst performance. |
1.2 The View
The concept of view is handled by the ol.View class and, as we have say previously, it determines how the map is visualized allowing to change the zoom level, the center location or the rotation angle.
When instantiating a new view we need, at least, to specify a center location and zoom level (or a resolution value) to have a full functional view instance:
1     var view = new ol.View({
2         center: [0, 0],
3         zoom: 2
4     });
1.2.1 Controlling the view
The view is controlled by three properties: center, resolution and rotation. For this purpose, ol.View class offers getter and setter methods like: getCenter, setCenter, setResolution, getResolution, getRotation and setRotation.
|
|
The view also offer the |
Given the next view instance:
1     var view = new ol.View({
2         projection: 'EPSG:4326'
3     });
we can set the center location:
1 view.setCenter([2.1833, 41.3833]);

|
In OpenLayers3 we can specify coordinates with a simple array with two values for longitude and latitude. Older versions requires to create an instance of the |
We can also change the resolution or zoom level:
1     view.setResolution(12000);
2     view.setZoom(7);
or rotate the view 5 degrees:
1 view.setRotation( 5 * Math.PI / 180);
|
|
Note the rotation angle must be expressed in radians, because of this we need to transform degrees to radians. |
In addition, the view has also a projection property, which is used to determine the coordinate system of the center. By default, the projection used is EPSG:3857. The properties getProjection and setProjection allows us to retrieve and set the projection value.
1.2.2 Resolutions and zoom levels
Usually, we talk about zoom levels and resolutions as if they were the same thing. It is true both are close related but it is important to understand the differences between them.
Lets take as example the tile images from the OpenStreetMap project. At level zero, one tile is used to show the whole world. At level one, four tiles are used to show the world. At level two, eight tiles. And so on.
Following this rule, we can see each zoom level is formed by  x
x tiles, where
 n is the zoom level.
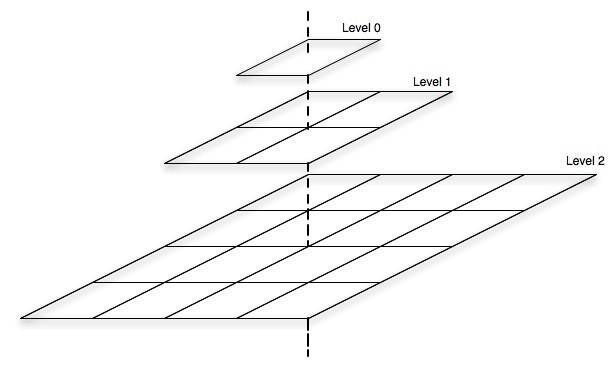
Zoom levels
Now, lets go to compute the resolution of each level. In EPSG:4326 projection, the length of the equator measures 40,075,016.686 meters. Working with a tile size of 256x256 pixels, that means, at zoom level zero the resolution of each pixel is 40,075,016.686 / 256 = 156,543.034 meter/pixel. At level one, two tiles are required to visualize the world so each tile represents (40,075,016.686 / 2) meters, the resolution of each pixel is (40,075,016.686 / 2) / 256 = 78,271.52 meters/pixel. Next table shows the relation among zoom levels, number of tiles and resolution:
| Zoom | Tiles | Resolution (meters) |
|---|---|---|
| 0 | 1x1 | 156,543.03 |
| 1 | 2x2 | 78,271.52 |
| 2 | 4x4 | 39,135.76 |
| 3 | 8x8 | 19,567.88 |
| … | … | … |
|
|
You can find more detail at the Slippy Map web page from OpenStreetMap project. |
Looking at the above table, we can understand why no matter which method to use to modify the view, if setZoom or setResolution, because both modifies the resolution property, the first specifying the zoom level and the second the resolution directly.
Even so the setZoom is probably more used than setResolution, since it is more easy to use because does not requires to remember big numbers.
1.2.3 The view properties
We have seen the the ol.View class has three important properties through which we can control it: center, resolution and rotation (plus the projection to indicate the view’s center coordinate system) but, in addition, it has other properties that can help us to configure it:
-
resolutions, an array of valid resolutions that determines the zoom levels, -
maxResolution, the maximum resolution (corresponds to the resolution value at zoom level zero), -
maxZoom, the maximum number of zoom levels, we could change the zoom level from level zero to this value, -
zoomFactor, we can understant it as the step value used to increase the zoom. By default it is2because of this each zoom level has half of the resolution of the previous level.
Note, these properties can only be used at instantiation time, there are no methods to modify its values once the view is initialized.
We need to take into account if the resolutions property is passed to the view constructor the other three will be ignored or, said with other words, we can not pass the resolutions property if we want to make use of the other properties. They are exclusive.
|
|
The |
Next code shows a view instance initialized using the resolutions property:
1     var view = new ol.View({
2         center: [0, 0],
3         zoom: 0,
4         resolutions: [78271.52 , 39135.76]
5     });
This means the view will have two zoom levels. The zoom level 0 that corresponds to the resolution value 78271.52 and the zoom level 1 that corresponds to the resolution 39135.76. Because the second value is half of the first, the zoomFactor of the view is 2. The maxResolution property corresponds to the value 78271.52 and the maxZoom is 1.
Now, compare to the next example:
1     var view = new ol.View({
2         center: [0,0],
3         zoom: 0,
4         maxResolution: 78271.52,
5         maxZoom: 1,
6         zoomFactor: 2
7     });
With this configuration we will have two zoom levels, because the maxZoom=1, level 0 with a corresponding resolution of 78271.52 and level 1 that will be automatically computed as 78271.52 / 2 = 39135.76. If we were specified a maxZoom=2 we have been got three zoom levels, from 0 to 2, and the zoom level 2 would be computed as 39135.76 / 2 = 19567.88.
1.2.4 Other useful methods
In addition to the getter and setter methods previously seen, the ol.View offers other methods can be useful in some situations.
-
fitExtent, adjust the view location and zoom level to a given extent, -
calculateExtent, returns the current extent visualized by the view, -
constrainResolution, given a resolution value returns the closest valid available resolution, -
constrainRotation, adjusts a rotation value given a set or rules.
So, given a map instance we can get the current extent we are visualizing with:
1     var view = map.getView();
2     var extent = view.calculateExtent( map.getSize() );
|
|
Because a view can be used for more than one map instance, you need to specify the map size in the |
Now, we can navigate in the map and return to the original place applying the previous extent:
1 view.fitExtent( extent, map.getSize() );
Supposing the next map instance that uses a view with two resolutions:
1     var map = new ol.Map({
2         ...
3         view: new ol.View({
4             resolutions: [78271.52 , 39135.76],
5             ...
6         }),
7         ...
8     });
we can change the view resolution specifying a zoom level with the setZoom method:
1 view.setZoom(1);
or we can change the view resolution to any desired value using setResolution method:
1 view.setResolution(40000);
But.. what if we want to restrict resolution values to one of the valid values defined? Using the constrainResolution method we can constrain the resolution value before setting it:
1     var resolution = constrainResolution(40000);    // This will return 39135.76
2     view.setResolution(resolution);
1.3 Animations
Modifying the view using its setter methods gives us lot of flexibility but, unfortunately, the changes on its properties (zoom level or center location) can be too much sudden. Sometimes what we desire is a more user friendly movement, like a nice displacement to some location. For this purpose, OpenLayers3 offers the concept of animation.
1.3.1 The animation functions
Animations are functions specially designed to tween the view properties (center, rotation and resolution) producing a nice transition effects.
Next are all the available animations, which resides within the ol.animation namespace:
-
ol.animation.pan, modifies the view’s center, -
ol.animation.rotate, modifies the rotation angle, -
ol.animation.zoom, modifies the zoom property, -
ol.animation.bounce, modifies the resolution property to create a bounce effect.
Each of these functions returns a new one that does the real animation task. Because each function is appropriate for a view property (center, rotation or resolution) each function requires we need to specify at least one option. For the ol.animation.pan we need to specify the source point where to start the animation:
1     var pan = ol.animation.pan({
2         source: ... // Initial center location
3     });
For the ol.animation.rotate we need to specify at least the rotation options with the angle value.
1     var rotate = ol.animation.rotate({
2         rotation: ... // Initial rotation angle
3     });
Finally, for the ol.animation.zoom and ol.animation.bounce we need to specify the resolution option.
1     var zoom = ol.animation.zoom({
2         resolution: ... // Initial resolution
3     });
1.3.2 The tween functions
In addition to the animation functions, OpenLayers3 offers a set of tween functions that allows control the transition of the values to be modified. This way, we have more degree of flexibility, because we can mix the animation function with the tween function it must be used.
A tween function allows to modify a variable in a specified duration of time from an initial to a final value. Within that duration, each time we execute the function it will return a value between the initial and final according to a mathematic formula.
The tween functions are located at the ol.easing namespace and they are:
-
ol.easing.easeIn, start slow and speed up, -
ol.easing.easeOut, start fastest and slows to a stop, -
ol.easing.inAndOut, start slow, speed up, then slow down, -
ol.easing.linear, constantly in time, -
ol.easing.bounce, bounce effect, -
ol.easing.elastic, elastic effect, -
ol.easing.upAndDown, increases and decreases a value.
|
|
Note the |
All the animations accepts the easing and duration options. With the easing we can specify the tween function to be used, while with the duration we specify the time of the transition in milliseconds:
1     var pan = ol.animation.pan({
2         duration: 2000,
3         easing: ol.easing.bounce,
4         source: map.getView().getCenter()
5     });
1.3.3 Applying animations
The map is almost constantly refreshing. Each time a change is produced, like when you pan the map or when a layer loads new data, the map is completely rendered.
The renderer process is reasonably complicated. It needs to render all the data layers of the map, both raster and vector, the controls and the overlays. All this taking into account properties like the projection, the view center or the resolution, not to mention the features styling, and with the addition it can be made using three different mechanisms: WebGL, canvas and DOM.
You’ll be asked why I’m talking about the rendering process, and the answer is because the animations are placed at the beginning of it.
The ol.Map class offers the beforeRender method that accepts a so called preRender function as parameter. If you look at the OpenLayers3 source code you will find they are functions with the ol.PreRenderFunction type definition. Hopefully for us, all the functions in the ol.animation namespace are suitable to be used as preRender functions.
After all the explanation, we can summarize that to create an animation we need to follow the next three steps:
- Create the desired animation function, optionally setting the desired tween function,
- Attach it to the map, using the
beforeRendermethod, - Make the change on the view to trigger the animation.
|
|
Remember the options passed to the animation function acts as the initial value while the value specified when modifying the view acts as the final value, so the animation will go from the initial to the final value using the specified tween function. |
Next code creates a pan animation from the current view center to the coordinate origins:
1     // Define an animation function setting the current view's center
2     // as the initial position
3     var pan = ol.animation.pan({
4         source: map.getView().getCenter()
5     });
6     // Attach to the map
7     map.beforeRender(pan);
8     // Modify the view to a final position
9     map.getView().setCenter([0, 0]);
Next, increases 10 degrees the view’s rotation angle, animating it with a bounce effect:
 1     // Define an animation function setting the current view's rotation
 2     // as the initial angle value
 3     var pan = ol.animation.rotate({
 4         rotation: map.getView().getRotation(),
 5         easing: ol.easing.bounce
 6     });
 7     // Attach to the map
 8     map.beforeRender(pan);
 9     // Modify the view's rotation angle to a final value
10     map.getView().setRotation(map.getView().getRotation() + 10 * Math.PI / 180);
|
|
Take into account, the animations are available only once within the rendering process. Each time we add an animation to the map using the |
1.4 The practice
All the examples follows the code structured described at section Getting ready for programming with OpenLayer3 on chapter Before to start.
The source code for all the examples can be freely downloaded from thebookofopenlayers3 repository.
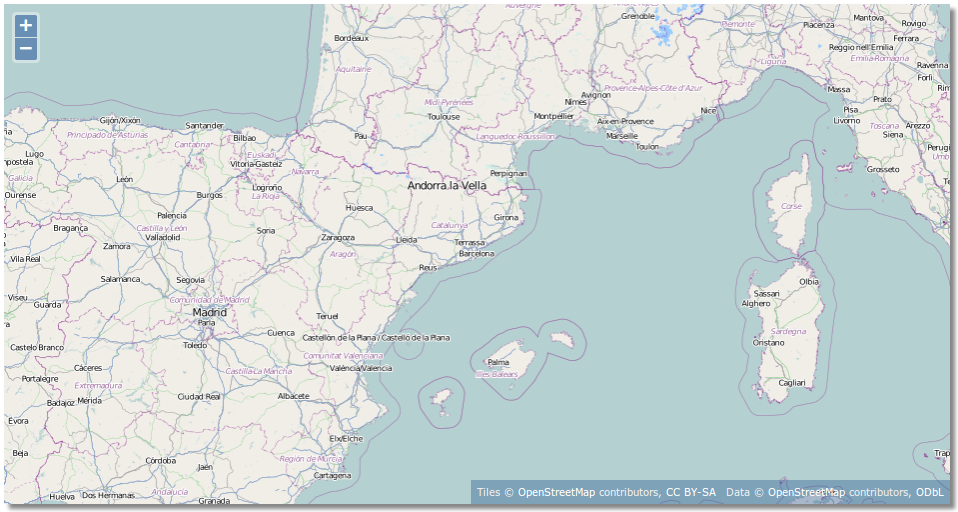
1.4.1 A basic map
1.4.1.1 Goal
Introduce the ol.Map and ol.View classes and see how to create a basic map.
1.4.1.2 How to do it…
The map needs to be rendered on an HTML element, so we are going to use a <div> element:
1 <div id="map" class="map"></div>
The HTML element uses a CSS class we use to define its size. Within the <head> section of the HTML document add an <style> with the next code:
1     .map {
2         width: 100%;
3         height: 500px;
4         box-shadow: 5px 5px 5px #888;
5     }
It makes the map 100% width and 500 pixels height and adds a nice shadow effect to emulate the map is floating over the page.
Now we can add the JavaScript code responsible to create the map. At the end of the document body add a <script> element with:
 1     var map = new ol.Map({
 2         target: 'map',  // The DOM element that will contains the map
 3         renderer: 'canvas', // Force the renderer to be used
 4         layers: [
 5             // Add a new Tile layer getting tiles from OpenStreetMap source
 6             new ol.layer.Tile({
 7                 source: new ol.source.OSM()
 8             })
 9         ],
10         // Create a view centered on the specified location and zoom level
11         view: new ol.View({
12             center: ol.proj.transform([2.1833, 41.3833], 'EPSG:4326', 'EPSG:3857\
13 '),
14             zoom: 6
15         })
16     });
1.4.1.3 How it works…
A map requires a target, a HTML element where to render it, so we have specified the identifier of the <div> element previously created:
1 target: 'map'
|
|
Remember the |
There has no sense a map without at least a layer. The layers of the map can be specified at initialization time passing an array of layers to the layers property. In the sample, we have created a layer that loads tiles from OpenStreetMap project:
1     layers: [
2         // Add a new Tile layer getting tiles from OpenStreetMap source
3         new ol.layer.Tile({
4             source: new ol.source.OSM()
5         })
6     ]
Finally, the map requires a view which controls how it is rendered (defines the center location, the zoom level, etc). In the sample, we have created a 2D view, centered near of Barcelona city (Spain) and using a zoom level equal to 6:
1     view: new ol.View({
2         center: ol.proj.transform([2.1833, 41.3833], 'EPSG:4326', 'EPSG:3857'),
3         zoom: 6
4     })
The ol.View has a projection property that determines the coordinate system of the view’s center. By default this projection is EPSG:3857 and because of this, if we specify the center location in a different projection we need to transform it. In the sample we have set the center to [2.1833, 41.3833], which is EPSG:4326, so we transform it using the ol.proj.transform method.
1.4.2 Moving around
1.4.2.1 Goal
Demonstrate how we can change the view properties programmatically. We are going to create three forms to modify the center location, the rotation angle and the zoom level.
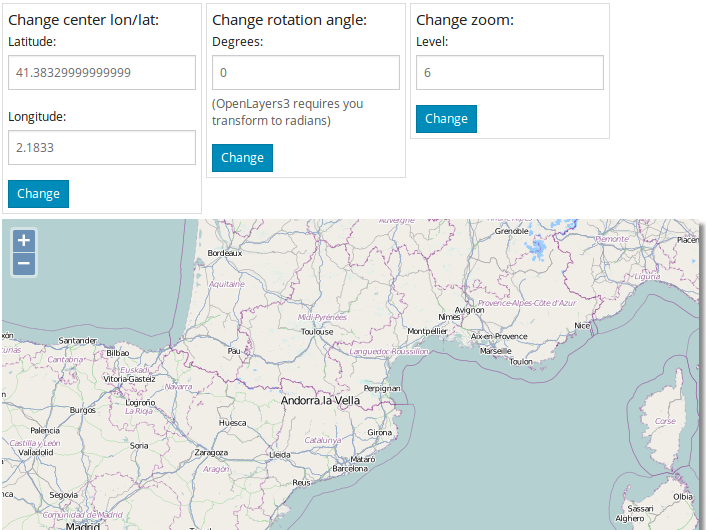
Moving around
1.4.2.2 How to do it…
First we need to add the HTML code for the forms and the HTML to hold the map:
 1     <div class="example">
 2         Change center lon/lat:
 3         <form role="form">
 4             <div class="form-group">
 5                 <label for="lat">Latitude:</label>
 6                 <input type="text" class="form-control" id="lat" placeholder="lo\
 7 ngitude" value="0.0">
 8             </div>
 9             <div class="form-group">
10                 <label for="lon">Longitude:</label>
11                 <input type="text" class="form-control" id="lon" placeholder="la\
12 titude" value="0.0">
13             </div>
14
15             <button type="button" class="btn btn-primary btn-xs" id="changeCente\
16 r">Change</button>
17         </form>
18     </div>
19
20     <div class="example">
21         Change rotation angle:
22         <form role="form">
23             <div class="form-group">
24                 <label for="angle">Degrees:</label>
25                 <input type="text" class="form-control" id="angle" placeholder="\
26 rotation angle" value="5.0">
27                 <span class="help-block">(OpenLayers3 requires you transform to \
28 radians)</span>
29             </div>
30
31             <button type="button" class="btn btn-primary btn-xs" id="changeRotat\
32 ion">Change</button>
33         </form>
34     </div>
35
36     <div class="example">
37         Change zoom:
38         <form role="form">
39             <div class="form-group">
40                 <label for="level">Level:</label>
41                 <input type="text" class="form-control" id="level" placeholder="\
42 zoom level" value="7">
43             </div>
44
45             <button type="button" class="btn btn-primary btn-xs" id="changeZoom"\
46 >Change</button>
47         </form>
48     </div>
49
50     <div id="map" class="map"></div>
We use some CSS classes to beautify the map and define the forms width. Within the <head> section of the HTML document add an <style> with the next code:
 1     .map {
 2         width: 100%;
 3         height: 500px;
 4         box-shadow: 5px 5px 5px #888;
 5     }
 6     .example {
 7         width: 200px;
 8         border: 1px solid #ddd;
 9         padding: 5px;
10         display: inline-block;
11         vertical-align: top;
12     }
Finally add the JavaScript to initialize the map and modify view properties when buttons are clicked. At the end of the document body add a <script> element with:
 1     var map = new ol.Map({
 2         target: 'map',  // The DOM element that will contains the map
 3         renderer: 'canvas', // Force the renderer to be used
 4         layers: [
 5             // Add a new Tile layer getting tiles from OpenStreetMap source
 6             new ol.layer.Tile({
 7                 source: new ol.source.OSM()
 8             })
 9         ],
10         // Create a view centered on the specified location and zoom level
11         view: new ol.View({
12             center: ol.proj.transform([2.1833, 41.3833], 'EPSG:4326', 'EPSG:3857\
13 '),
14             zoom: 6
15         })
16     });
17
18     $(document).ready(function() {
19
20         var center = ol.proj.transform(map.getView().getCenter(), 'EPSG:3857', '\
21 EPSG:4326');
22
23         $('#lon').val(center[0]);
24         $('#lat').val(center[1]);
25         $('#angle').val(map.getView().getRotation());
26         $('#level').val(map.getView().getZoom());
27
28         $('#changeCenter').on('click', function() {
29             var center = [parseInt($('#lon').val()), parseInt($('#lat').val())];
30             map.getView().setCenter(ol.proj.transform(center, 'EPSG:4326', 'EPSG\
31 :3857'));
32         });
33
34         $('#changeRotation').on('click', function() {
35             map.getView().setRotation($('#angle').val() * Math.PI / 180);
36         });
37
38         $('#changeZoom').on('click', function() {
39             map.getView().setZoom($('#level').val());
40         });
41     });
|
|
We are using jQuery library, so the code responsible to handle buttons events is enclosed within the |
1.4.2.3 How it works…
The map is initialized in the same way as in the A basic map example.
Once the document is fully loaded we initialize the form input texts with the current view properties values (the current center point, rotation and zoom level):
1     var center = ol.proj.transform(map.getView().getCenter(), 'EPSG:3857', 'EPSG\
2 :4326');
3
4     $('#lon').val(center[0]);
5     $('#lat').val(center[1]);
6     $('#angle').val(map.getView().getRotation());
7     $('#level').val(map.getView().getZoom());
Thanks to jQuery, we have registered a listener function that is executed when the button is clicked. Next is the registration for the button responsible to modify the center location:
1     $('#changeCenter').on('click', function() {
2         // Actions here
3     });
Because the view uses, by default, the EPSG:3857 projection and we are specifying the center location using EPSG:4326 values, when the user changes the center, the listener function gets the new longitude and latitude values and transforms them using the ol.proj.transform() method:
1     var center = [parseInt($('#lon').val()), parseInt($('#lat').val())];
2     map.getView().setCenter(ol.proj.transform(center, 'EPSG:4326', 'EPSG:3857'));
Note how the array with the new position is specified with [lon, lat] values (and not [lat, lon]).
When user changes the rotation angle, the listener function must get the new value specified in degrees and translate to radians:
1 map.getView().setRotation($('#angle').val() * Math.PI / 180);
Finally, the listener responsible to change the zoom level simply requires to get the new value and apply it:
1 map.getView().setZoom($('#level').val());
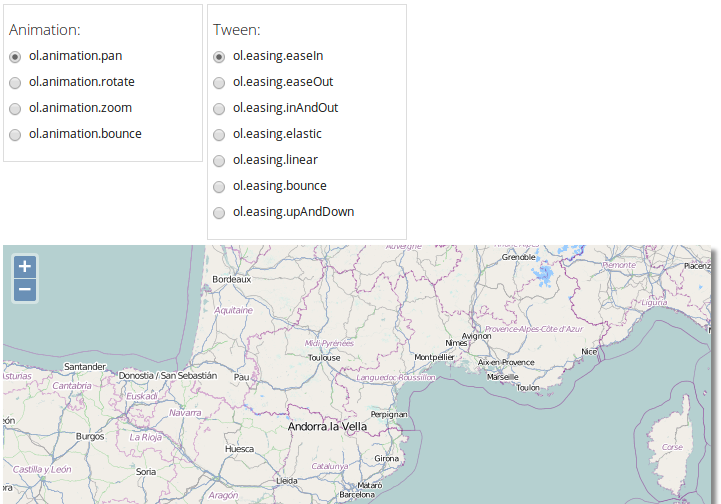
1.4.3 Animating the view
1.4.3.1 Goal
Explain how to create animations to interact with the view.
We will create two different radio buttons list where to select the different combinations between animation and tween functions. Each time the user clicks the map the animation will be executed.
Moving around
1.4.3.2 How to do it…
First we need to add the HTML code for the radio buttons and the map element:
 1     <div class="example" id="animation">
 2         <h5>Animation:</h5>
 3
 4         <div class="radio">
 5             <label>
 6                 <input type="radio" name="animationGroup" value="pan" checked>
 7                 ol.animation.pan
 8             </label>
 9         </div>
10         <div class="radio">
11             <label>
12                 <input type="radio" name="animationGroup" value="rotate">
13                 ol.animation.rotate
14             </label>
15         </div>
16         <div class="radio">
17             <label>
18                 <input type="radio" name="animationGroup" value="zoom">
19                 ol.animation.zoom
20             </label>
21         </div>
22         <div class="radio">
23             <label>
24                 <input type="radio" name="animationGroup" value="bounce">
25                 ol.animation.bounce
26             </label>
27         </div>
28     </div>
29
30     <div class="example" id="tween">
31         <h5>Tween:</h5>
32
33         <div class="radio">
34             <label>
35                 <input type="radio" name="tweenGroup" value="easeIn" checked>
36                 ol.easing.easeIn
37             </label>
38         </div>
39         <div class="radio">
40             <label>
41                 <input type="radio" name="tweenGroup" value="easeOut">
42                 ol.easing.easeOut
43             </label>
44         </div>
45         <div class="radio">
46             <label>
47                 <input type="radio" name="tweenGroup" value="inAndOut">
48                 ol.easing.inAndOut
49             </label>
50         </div>
51         <div class="radio">
52             <label>
53                 <input type="radio" name="tweenGroup" value="elastic">
54                 ol.easing.elastic
55             </label>
56         </div>
57         <div class="radio">
58             <label>
59                 <input type="radio" name="tweenGroup" value="linear">
60                 ol.easing.linear
61             </label>
62         </div>
63         <div class="radio">
64             <label>
65                 <input type="radio" name="tweenGroup" value="bounce">
66                 ol.easing.bounce
67             </label>
68         </div>
69         <div class="radio">
70             <label>
71                 <input type="radio" name="tweenGroup" value="upAndDown">
72                 ol.easing.upAndDown
73             </label>
74         </div>
75     </div>
76
77     <div id="map" class="map"></div>
Add some CSS classes and styles to beautify the map and the controls:
 1     .map {
 2         height: 500px;
 3         margin: 5px auto;
 4         box-shadow: 5px 5px 5px #888;
 5     }
 6     .example {
 7         width: 200px;
 8         border: 1px solid #ddd;
 9         padding: 5px;
10         display: inline-block;
11         vertical-align: top;
12         font-size: 0.8em;
13     }
Finally add the JavaScript code responsible to create the view animations:
 1     var map = new ol.Map({
 2         target: 'map',  // The DOM element that will contains the map
 3         renderer: 'canvas', // Force the renderer to be used
 4         layers: [
 5             // Add a new Tile layer getting tiles from OpenStreetMap source
 6             new ol.layer.Tile({
 7                 source: new ol.source.OSM()
 8             })
 9         ],
10         // Create a view centered on the specified location and zoom level
11         view: new ol.View({
12             center: ol.proj.transform([2.1833, 41.3833], 'EPSG:4326', 'EPSG:3857\
13 '),
14             zoom: 6
15         })
16     });
17
18     /**
19      * Creates the appropriate animation given the specified animation
20      * and tween functions.
21      */
22     function createAnimation(animationFunction, tweenFunction) {
23         var params = {
24             easing: eval(tweenFunction)
25         };
26
27         if (animationFunction === ol.animation.pan) {
28             params.source = map.getView().getCenter();
29         } else if (animationFunction === ol.animation.rotate) {
30             params.rotation = map.getView().getRotation();
31         } else if (animationFunction === ol.animation.bounce) {
32             params.resolution = map.getView().getResolution() * 2;
33         } else {
34             params.resolution = map.getView().getResolution();
35         }
36
37         return animationFunction(params);
38     }
39
40     /**
41      * Register a listener for a singleclick event on the map.
42      */
43     map.on('singleclick', function(event) {
44         var animationFunction = ol.animation[ $("#animation input:checked").val(\
45 ) ];
46         var tweenFunction = ol.easing[ $("#tween input:checked").val() ];
47
48         var animation = createAnimation(animationFunction, tweenFunction);
49
50         // Add animation to the render pipeline
51         map.beforeRender(animation);
52
53         // Modify the view
54         if (animationFunction === ol.animation.pan) {
55             // Change center location
56             map.getView().setCenter(event.getCoordinate());
57         } else if (animationFunction === ol.animation.rotate) {
58             // Increase rotation angle 10 degrees
59             map.getView().setRotation(map.getView().getRotation() + 10 * Math.PI\
60  / 180);
61         } else if (animationFunction === ol.animation.bounce) {
62             map.getView().setCenter(map.getView().getCenter());
63         } else {
64             // Change zooom
65             map.getView().setResolution(map.getView().getResolution() / 2);
66         }
67     });
1.4.3.3 How it works…
As we saw at Animations section from The Map and the View chapter, animations are functions specially designed to modify a view property. In addition, each animation function will change the property value using a tween function, which determines how a value changes on time. This way we can use different tween functions for the same animation producing different effects.
Because we want to start the animation when the user clicks on the map we have registered a listener function for the singleclick event:
1     map.on('singleclick', function(event) {
2         ...
3     });
The listener function is responsible to:
- Get the selected animation and tween functions,
- Create the animation,
- Apply to the map,
- Modify the view to the animation takes effect.
Animations are defined as properties of the ol.animation object (for example ol.animation.pan), while the tween functions are defined at ol.easing (for example ol.easing.easeOut).
In JavaScript we can get an object property using object.propertyName or object['propertyName']. We are going to use the second form, because of this we first need to get the animation function name and get a reference to the animation function (and the same for tween function):
1     var animationFunction = ol.animation[ $("#animation input:checked").val() ];
2     var tweenFunction = ol.easing[ $("#tween input:checked").val() ];
Once we have a reference to the functions we want to use we create the animation with the createAnimation function:
1 var animation = createAnimation(animationFunction, tweenFunction);
All the animation functions accepts easing property with a reference to the tween property to be use (and also other common properties like the duration).
The issue is, because each animation function is implemented to modify a specific view property, we need appropriate property. As we can see in the code, of the animation function is the ol.animation.pan we specify the source property pointing the initial center location where to start the pan animation.
When the animation function is the ol.animation.rotate we specify the rotation property with the current rotation angle value and, finally if the animation function is ol.animation.bounce or ol.animation.zoom we specify the resolution property.
 1     function createAnimation(animationFunction, tweenFunction) {
 2         var params = {
 3             easing: eval(tweenFunction)
 4         };
 5
 6         if (animationFunction === ol.animation.pan) {
 7             params.source = map.getView().getCenter();
 8         } else if (animationFunction === ol.animation.rotate) {
 9             params.rotation = map.getView().getRotation();
10         } else if (animationFunction === ol.animation.bounce) {
11             params.resolution = map.getView().getResolution() * 2;
12         } else {
13             params.resolution = map.getView().getResolution();
14         }
15
16         return animationFunction(params);
17     }
Once we have the animation created we need to apply it to the map:
1 map.beforeRender(animation);
|
|
Remember the animations are attached to the beginning of the rendering pipeline to take be consumed the next time the map is rendered. Once the animation is consumed it is removed from the pipeline. See Applying animations section at The Map and the View chapter. |
So that the animation takes effect we need to change the view property which animation modifies. Next code checks the selected animation and changes the appropriate property:
 1     if (animationFunction === ol.animation.pan) {
 2         // Change center location
 3         map.getView().setCenter(event.getCoordinate());
 4     } else if (animationFunction === ol.animation.rotate) {
 5         // Increase rotation angle 10 degrees
 6         map.getView().setRotation(map.getView().getRotation() + 10 * Math.PI / 1\
 7 80);
 8     } else if (animationFunction === ol.animation.bounce) {
 9         map.getView().setCenter(map.getView().getCenter());
10     } else {
11         // Change zooom
12         map.getView().setResolution(map.getView().getResolution() / 2);
13     }
1.4.4 Fit an extent
1.4.4.1 Goal
This example demonstrate how we can use some ol.View methods to set the view in a given zoom level and center to fit a given extent.
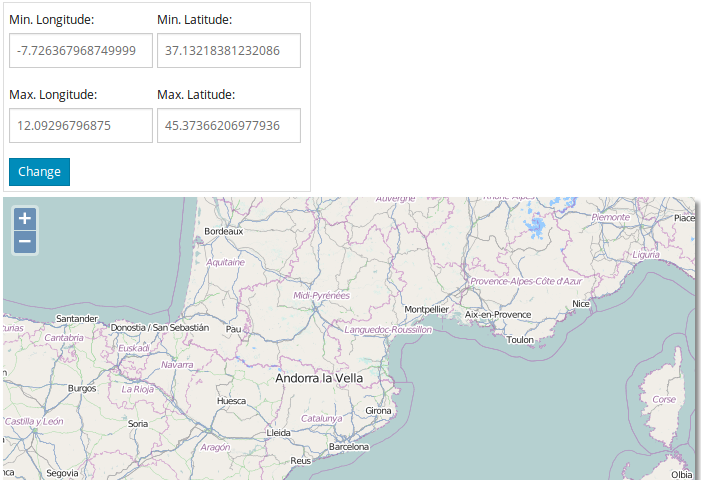
Fit extent
For this purpose we will create some input controls that will show the current view extent and allows us to modify it.
1.4.4.2 How to do it…
Start adding the HTML for the form controls:
 1     <form role="form">
 2         <div class="form-group">
 3             <label for="lon">Min. Longitude:</label>
 4             <input type="text" class="form-control" id="minlon" placeholder="lat\
 5 itude" value="0.0">
 6         </div>
 7         <div class="form-group">
 8             <label for="lat">Min. Latitude:</label>
 9             <input type="text" class="form-control" id="minlat" placeholder="lon\
10 gitude" value="0.0">
11         </div>
12         <br/>
13         <div class="form-group">
14             <label for="lon">Max. Longitude:</label>
15             <input type="text" class="form-control" id="maxlon" placeholder="lat\
16 itude" value="0.0">
17         </div>
18         <div class="form-group">
19             <label for="lat">Max. Latitude:</label>
20             <input type="text" class="form-control" id="maxlat" placeholder="lon\
21 gitude" value="0.0">
22         </div>
23         <br/>
24         <button type="button" class="btn btn-primary btn-xs" id="change">Change<\
25 /button>
26     </form>
Add the <div> element to hold the map and some CSS code to beautify it:
1 <div id="map" class="map"></div>
Read the A basic map if you want to know how to beautify a bit the map element.
Add JavaScript code to initialize the map:
 1     var map = new ol.Map({
 2         target: 'map',  // The DOM element that will contains the map
 3         renderer: 'canvas', // Force the renderer to be used
 4         layers: [
 5             // Add a new Tile layer getting tiles from OpenStreetMap source
 6             new ol.layer.Tile({
 7                 source: new ol.source.OSM()
 8             })
 9         ],
10         // Create a view centered on the specified location and zoom level
11         view: new ol.View({
12             center: ol.proj.transform([2.1833, 41.3833], 'EPSG:4326', 'EPSG:3857\
13 '),
14             zoom: 6
15         })
16     });
Finally add the JavaScript code responsible to get and set the view extent:
 1     $(document).ready(function() {
 2
 3         // Compute the current extent of the view given the map size
 4         var extent = map.getView().calculateExtent(map.getSize());
 5
 6         // Transform the extent from EPSG:3857 to EPSG:4326
 7         extent = ol.extent.applyTransform(extent, ol.proj.getTransform("EPSG:385\
 8 7", "EPSG:4326"));
 9
10         $('#minlon').val(extent[0]);
11         $('#minlat').val(extent[1]);
12         $('#maxlon').val(extent[2]);
13         $('#maxlat').val(extent[3]);
14
15         $('#change').on('click', function() {
16
17             var minlon = parseInt($('#minlon').val());
18             var minlat = parseInt($('#minlat').val());
19             var maxlon = parseInt($('#maxlon').val());
20             var maxlat = parseInt($('#maxlat').val());
21
22             // Trasnform extent to EPSG:3857
23             var extent = [minlon, minlat, maxlon, maxlat];
24             extent = ol.extent.applyTransform(extent, ol.proj.getTransform("EPSG\
25 :4326", "EPSG:3857"));
26
27             map.getView().fitExtent(extent, map.getSize());
28         });
29     });
1.4.4.3 How it works…
The first action we do when the page is loaded is to get the current view extent and initialize the form inputs. To do so, we use the calculateExtent method that requires to pass the map size in pixels.
|
|
Remember, because a view can be used on different maps it has no reference to a specific map, so we need to pass the map size. The view can not get it automatically. |
1 var extent = map.getView().calculateExtent(map.getSize());
Now, we have an array with the extent the view is currently shown in the form of [min-longitude, min-latitude, max-longitude, min-latitude].
|
|
There is no class to represent the extent, neither a latitude-longitude pair location. In OpenLayers3 any four element array can us used as an extent and any two element array as a latitude-longitude location. |
The map uses is using the default view projection that is the EPSG:3857 but we want to show values as EPSG:4326, so we need to transform it.
The ol.extent object has some functions designed to work with extents. Among them we can find the ol.extent.applyTransform that accepts two parameters: the extent to work on and a transform function. Anyone can create a transform function that operates on a extent but OpenLayers3 offers us the most common ones.
In a similar way, ol.proj object contains functions to work with projections. Given two projection codes, the ol.proj.getTransform returns a function that knows how to transform between the specified projections.
So, the code to transform the view extent from EPSG:3857 to EPSG:4326 is:
1     extent = ol.extent.applyTransform(extent, ol.proj.getTransform("EPSG:3857", \
2 "EPSG:4326"));
Once we have the extent in our preferred projection we set the values in the inputs:
1     $('#minlon').val(extent[0]);
2     $('#minlat').val(extent[1]);
3     $('#maxlon').val(extent[2]);
4     $('#maxlat').val(extent[3]);
Now the user can change the input values and set a different extent for the view. When the user clicks the change button we must obtain the input values:
 1     $('#change').on('click', function() {
 2
 3         var minlon = parseInt($('#minlon').val());
 4         var minlat = parseInt($('#minlat').val());
 5         var maxlon = parseInt($('#maxlon').val());
 6         var maxlat = parseInt($('#maxlat').val());
 7
 8         // Continue code here
 9         ...
10     });
create an extent and transform it from EPSG:4326 to EPSG:3857 projection:
1         // Trasnform extent to EPSG:3857
2         var extent = [minlon, minlat, maxlon, maxlat];
3         extent = ol.extent.applyTransform(extent, ol.proj.getTransform("EPSG:432\
4 6", "EPSG:3857"));
and apply to the view using the fitExtent method that, similarly than calculateExtent, requires the map size in pixels:
1 map.getView().fitExtent(extent, map.getSize());