4. Treat your pipeline as a product for resiliency and fast feedback loops


Your delivery pipeline encompasses everything that must be done in order to release an application change. This includes code changes, infrastructure changes, and configuration updates. A pipeline is the orchestration of activities, whereby some of them require environments for testing, QA, up to production.
4.1 Make your pipeline the single route to production
The tools used in most delivery pipelines are treated poorly - poorly maintained, patched, backed up, etc - and yet, if these tools were to break down, a company’s ability to release software would be brought to a halt. Tools are also not regularly updated, missing out on useful new features. Often because no-one feels responsible for them. It is shocking how many forward thinking, diligent teams, where emphasis is put on code quality, can neglect the suite of tools they so heavily rely upon.
As the pipeline is your route to production, it becomes a part of production as well and all its parts should be treated as such. Pipeline configuration should be in source control, secrets should be secured, and backups taken regularly. Another activity that takes place in production is monitoring and logging. They should also be present in your pipeline tooling.
4.2 Your pipeline is now a product: invest in it
High performing teams deploy changes to production multiple times per day (ForsgrenHumbleKim2017). They rely on the delivery pipeline to build, secure, test and validate those changes before deployment. The pipeline is the system through which work flows into the customer’s hands.
In other words, the software delivery system has now become an essential product for internal use in any organization producing modern software. Because the delivery system is often a composition of 3rd party tools (vendor or open source or a mix) with some “glue code” (scripts), configurations and customizations, it is tempting to look at it as just another set of tools, not as a full-fledged system that provides a critical service to the organization (Christian Deger recommends thinking of it as “CD-as-a-Service” (Deger2018b), an approach taken by ING Bank (Romano2017) for example).
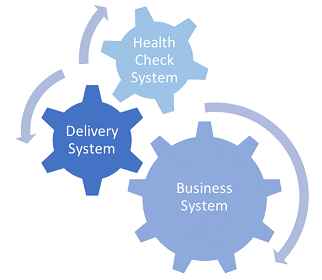
Instead, we should be thinking of modern IT as running at least three types of interconnected systems (inspired by a conversation with Mirco Hering (Hering2018)):
- customer-facing business systems (we include here internal customers as well)
- operations-facing runtime health check systems (including monitoring, alerting and repairing)
- development-facing software delivery systems
All of them need to be managed as critical systems for the organization, not just the customer-facing apps or services. Without reliable runtime health checks, we won’t be aware that a customer-facing system is facing issues until customers are complaining. Without fast and safe delivery, we can’t put out fixes predictably and with confidence.
Having these systems in place is a fundamental enabler of the first two of “The Three Ways of DevOps”, as outlined by Gene Kim (Kim2012):
- Systems thinking (first way): the delivery system connects dev to ops by visualizing status of changes and highlighting bottlenecks between commit and deploy to production.
- Amplify feedback loops (second way): the runtime health check system provides critical feedback on the performance of the commercial systems back to development.
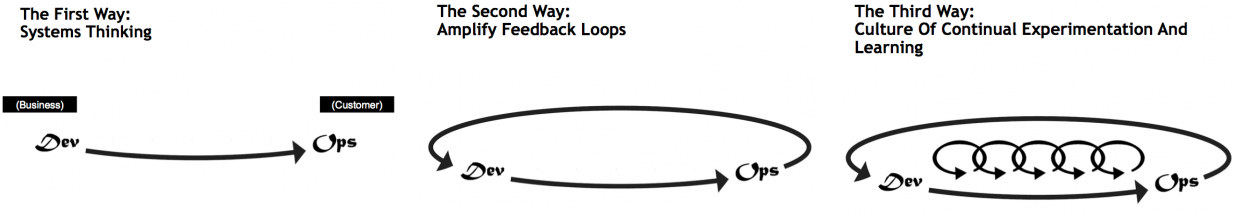
(Note: the third way is about establishing a culture of continual experimentation and learning. While systems can help, organizational culture (Westrum2004) and psychological safety (Delizonna2017) are the key enablers here)
4.3 Avoid simply retro-fitting CD into a CI server
In many organizations, teams installed Jenkins (or its cousin Hudson) in order to build their applications in a central server, in a clean environment that was not subject to the “works on my machine” syndrome. In some cases, this backfired into the “it only builds on the CI server” syndrome, but overall CI servers helped make the build process more predictable and traceable. While that’s only one of multiple steps needed to achieve continuous integration (Fowler2006), it helped many teams move a bit faster.
With the advent of Continuous Delivery those teams typically extended their use of the CI server from running a set of jobs to a structured pipeline that orchestrates a set of activities required to validate and deploy a change to production. However, it fell short of actually adopting continuous delivery. Often developers took initiative to adopt new plugins or even tools that supported the pipeline. Rushed fixes prevailed because there was never effort allocated explicitly to the evolution of the delivery system.
All this gets compounded by the fact that our pipelines include more and more activities (infrastructure updates, shift-left security testing, and so on). Execution time is already long, teams cannot afford adding wait time or downtime due to half-baked solutions in the delivery system.
The problem is not thinking about requirements or pipeline design. It can be ok to use simply Jenkins with plugins if that fits the requirements. It’s important to regularly reassess the requirements, ensuring that we use the best tool for the job and avoiding stretching tools beyond their purpose. Nevertheless, at some point it becomes important to consider adopting tools that natively embed CD concepts as these will tend to make it easier to adopt the CD practices.
In the next few sections, we will cover some important yet often overlooked approaches for an effective delivery system that promotes fast and safe delivery of changes.
4.4 Measure delivery to visualize flow and identify bottlenecks
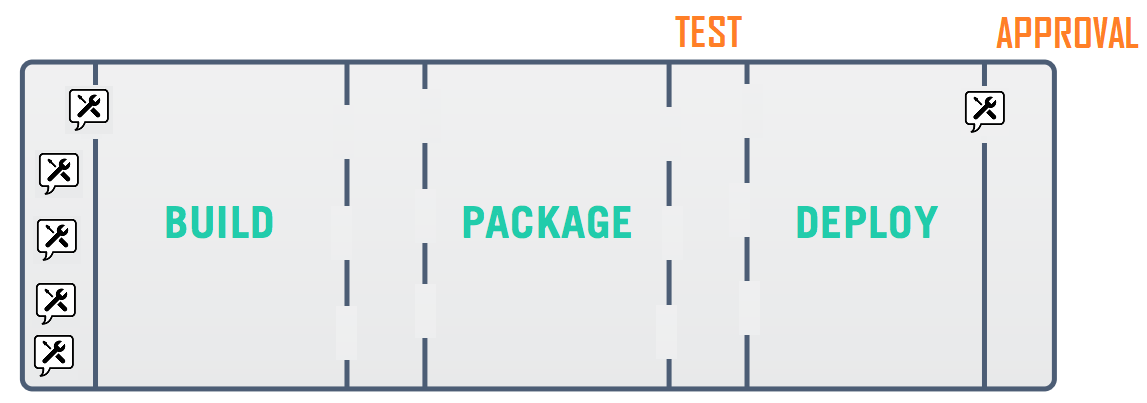
It’s natural to focus our attention on the build-test-deploy activities in the delivery pipeline. The whole team can immediately see that the latest build took 13 minutes to complete or that deployment to staging failed.
These are recurring, easy to observe results around automated activities in the pipeline. But how long did it take for someone to look into that failed deployment? What if it failed because a port must be opened in the staging and that can only be done by the IT security team sometime within the next couple of days?
We don’t usually track the answers to these other questions which are not directly provided by the pipeline.
But if we want to deliver changes faster and reduce lead time we need to have a good picture of all the activities that take place and, especially, the wait times getting a change into customer’s hands. Let’s walk through an example.
The team is working on this new feature that requires a new port for communication. This feature might require 20 to 30 pipeline runs until ready for production. If the team is able to reduce the build time from 13 to 10 minutes then we’d be reducing lead time by up to 3 minutes x 30 runs = 90 minutes.
Once the feature progresses through the pipeline, we stumble against that deployed failure to staging because of the missing open port. This is a one time fix (by the IT security team) but will take between a couple of hours and a few days, depending on the security team’s availability. Removing the dependency on the staging environment - for example, by dynamically provisioning ephemeral acceptance environments - would have reduced the lead time for this feature by at least 2h (33% more than the build time improvement).
Often there’s also no direct correlation between cost of the improvement and the benefit it brings. Simple changes can have a much higher impact in lead time than complicated technical changes. However, there’s a tendency to prefer those technical improvements that do not require approval or buy in from peers or managers. But we need to leave our comfort zone to make any significant progress.
And we need to measure to understand the highest bottlenecks in our delivery.
Another aspect to consider are trends and deviations. Looking at discrete pipeline metrics (latest build or test execution time, for example) without keeping in mind historical trends can lead to acceptance of an increasingly longer lead time. For example, if a suite of automated tests takes 1h to run in our pipeline today, and we increase it by 5 minutes (perhaps because we’re adding more tests for a new feature) we will probably find it reasonable. And if this happens again next week also. And next week. After only a month, we’ve now increased the test run time by one third! We need trends to put metrics in perspective and highlight deviations over time.
4.5 Design the delivery system to evolve with your needs
When setting up the delivery system there are a multitude of choices along the way. And your requirements, like with any customer-facing system, will change over time.
We recommend first of all focusing on (and documenting) the practices that the team wants to promote. Take for example the practice that all artifacts built should be stored for a set period of time:
- 1 day for all artifacts that did not get deployed to staging
- 1 week for all artifacts deployed to staging
- forever for all artifacts deployed to a live environment
A tool with artifact management capabilities will come in handy. Some initial functional requirements for this tool could include separate repositories per application, artifact promotion (for e.g. after deployment to staging), and of course defining the retention policies.
Now imagine you’ve containerized your application and you want your pipeline artifacts to be container images. Ideally, you would have included support for multiple binary formats, including container images, in the initial requirements. But chances are that this was not an anticipated move at the time.
After some research, the team concludes they need to migrate to another tool that supports the original requirements plus the new multi-format requirement. This should not be a headache in a delivery system that is maintainable and easy to change.
Choosing tools that support pipeline evolution means considering their (inter)operability capabilities. To begin with:
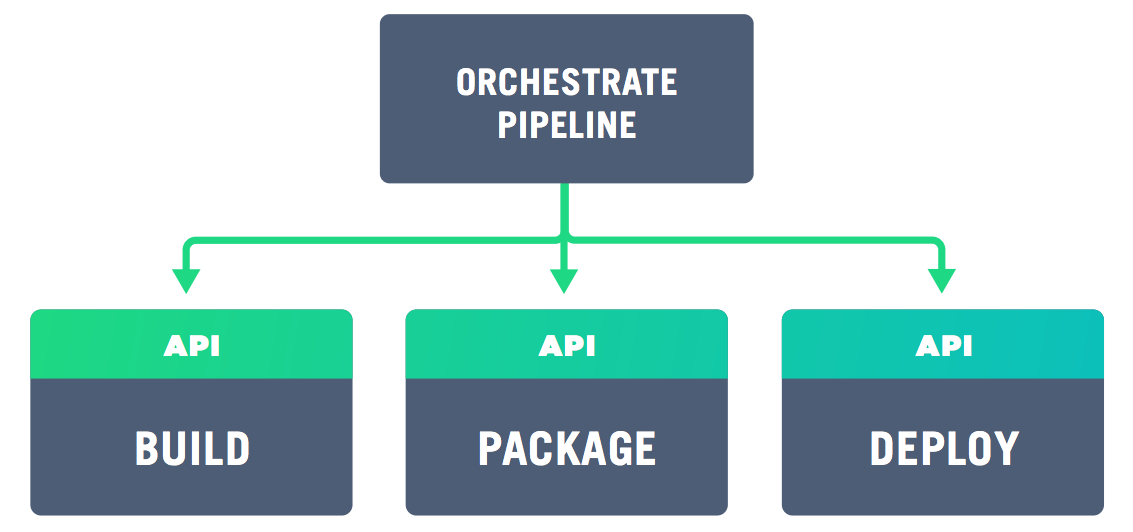
- does it expose features via an API (or at least an easy to install command-line interface)?
- does the API cover the entire feature set, not just a subset?
- does it provide access to logs?
- does it have good error handling and expose it in the logs?
In particular, the integration of disparate tools in our pipeline becomes much more maintainable when API-driven. If both the new and old artifact management tools support the operational requirements above then swapping them should be a matter of changing from the old to the new API calls (migrating existing artifacts is possibly more complicated, but the APIs should help if there’s no easy export/import mechanism).
The requirements for logging access and error handling support log aggregation and collecting metrics, as you would in a production system. We can dig deeper when tooling issues arise and we can look for trends related to build and other activities timings, failure rates and so on. In short, there is a wealth of tools in this space so it is important to pick ones which aid your process and help recover from failure, not hamper evolution by being a closed system.
Any delivery system - even if based on cloud managed services - needs some “glue code” and configuration to orchestrate different activities/tools at some point. The less code you need to maintain the better. But especially with self-managed delivery systems (even if tool agents and environments run in the cloud) the amount of pipeline code keeps increasing. We need to watch out for the same code smells (duplication, coupling, magic numbers, to name a few) and apply the same good practices (refactoring, single responsibility principle, design patterns) and code analysis (especially security wise) to ensure we keep that code clean and easy to extend. Avantika Mathur referred, jokingly, to a “Script-ocalypse” as the proliferation of poorly written scripts that become more and more costly to maintain (Mathur2018).
4.6 Apply monitoring and logging to minimize issues and downtime
Monitoring is the act of collecting real time data about your system and possibly alerting people when values go above, or below, a threshold. This includes, among others, low level monitoring of resources such as CPU load, remaining disk space and memory. You would never run a production system without these basic checks. As your pipeline is now a product and an extension of production, these checks should also be run on it.
Much like monitoring, no production system should be run without logging - diagnosing and debugging issues depends on it. In the case of a pipeline, the logs will be coming from the automation tools themselves. As a pipeline is generally composed of multiple tools running on multiple instances, log aggregation is required to make sense of what’s going on when the tooling breaks.
Log aggregation can help both the investigation of issues with the tools themselves (for example a new API version that returns a slightly different response to a call, breaking our delivery) or with the actual pipeline activities by providing more in-depth information on obscure failures.
Resiliency in software delivery requires continuous monitoring and alerting to detect failures early, just like business systems do. Issues that escape monitoring are good candidates for new tests or alert conditions on the delivery system.
4.7 Scale the infrastructure to avoid pipelines queuing up
As with customer-facing systems, when the usage grows the system must also scale, which generally requires a redesign of the architecture. The pipeline for a single team or a small number of teams does not look the same as a pipeline for a hundred or more teams. When scaling a production system it is important to identify your blockers so that efforts on scaling are targeted at the right place. The same applies for your pipeline (for more insights see “theory of constraints”, as introduced in GoldrattCox2014).
The most straightforward aspect that will need to scale with growing usage is the infrastructure. Ideally, if we want to prevent build and pipeline queues (as well as reduce execution time via parallelization), we need an elastic CI/CD infrastructure that can (auto-)scale up when necessary, and scale down. When using cloud infrastructure, that becomes straightforward as elasticity is a core selling point for cloud providers.
However, most organizations we’ve consulted for still prefer to run their delivery system on-premise. In this case, running pipeline agents in ephemeral containers (that live only during a given pipeline execution) can achieve a more efficient resource usage when compared to virtual machines or actual physical machines being used as agents. Still, this approach can only take you so far.
Monitoring low level resource usage (CPU, disk and memory) in your CI/CD infrastructure, and alerting when certain thresholds are reached, are the first steps to trigger a re-evaluation of the system capacity to cope with current usage. Again, trends are important here. 90% CPU usage might be an anomaly if it never passed 80% for the last 3 months, or it could be a sign of danger if usage has been steadily increasing in the last 3 months.
4.8 Scale the practices and pipelines to support growing usage
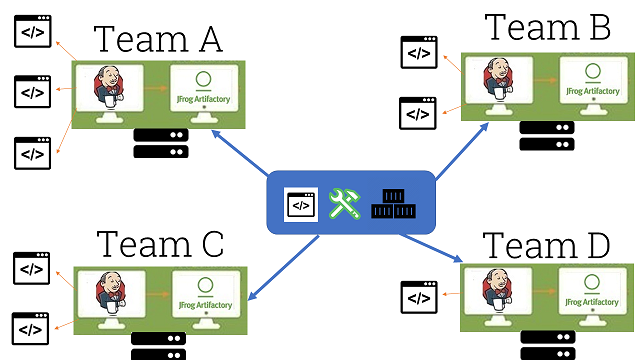
A less obvious concern when scaling CI/CD to a growing number of teams and users is the capacity to quickly onboard new teams and quickly spread good practices to all the teams already using the system.
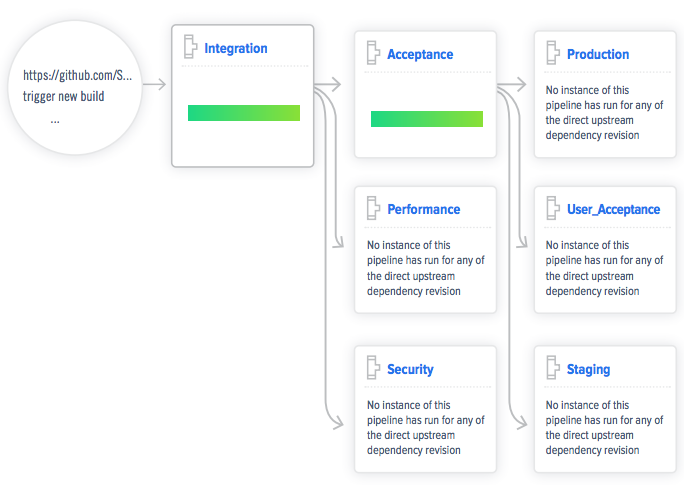
Pipeline-as-code, in similar fashion to infrastructure-as-code, allows defining all the steps, parameters, sources, dependencies and any other aspects of a given pipeline. This means that the pipeline can be defined before it’s actually created. Modern CD tools can search for pipeline definitions in a given repository and instantiate them, and update them every time a change to the definition is committed.
Besides reducing the chance for human error when configuring pipelines via the CD tool’s GUI, pipeline-as-code offers other far reaching benefits:
- creating a full pipeline from zero for a new application in a matter of minutes, by leveraging pipeline definitions with similar technological stack and delivery requirements
- promote reuse by parameterizing and pushing code to execute the pipeline stages down to be shared by multiple pipelines
- clearly assign the responsibility for defining the pipeline to the team that delivers the application (more on team organization patterns and responsibilities in chapter 8)
- allowing teams to share good practices by merging pipeline code (this requires making the practices explicit and decoupled from specific tools as much as possible)
4.9 Care for pipeline testability and usability to encourage adoption
Testability and usability are as important for a delivery system as for a customer-facing system. Testability helps reduce downtime due to untested changes to the pipeline and tools. Usability makes the pipeline actions and data accessible to a wider range of users, namely business owners.
It is all too common to find the delivery system that the application teams rely on being directly modified (for example, adding new tools), without prior testing. This has a high probability of leading to failures and possibly downtime. There is no reason not to run a CI/CD development environment (a scaled down replica of the delivery system) for testing those changes in isolation beforehand (further made easier when the CI/CD infrastructure is already codified).
By leveraging pipeline-as-code and creating pipelines for simple “Hello World” applications that mimic the actual application pipelines we can perform a sort of “smoke tests” of changes to the delivery system. This should include deployment to a production environment, knowing that the presence of the example app is harmless.
We are not done after testing in isolation though. By deploying with a blue-green approach we can then monitor for instabilities in the pipeline, and rollback to the previous version if necessary. Simultaneously reducing downtime and impact on the pipeline users.
4.10 Build security into and around the pipeline
Unfortunately, we can’t simply monitor security and wait to take measures when some threshold is reached. Very much like testing, we can never say security work is complete or that our system is fully secure.
Security needs to be a continuous activity and the earlier we embedded it in the software lifecycle the better. That is of course one of the core premises of DevSecOps (Riley2017), which focuses on building security in the pipeline.
Some straightforward techniques that we can and should be using today to improve the security of the applications we’re delivering and their dependencies:
- relying on a mature secrets management tool
- minimizing attack surface by keeping OS images as small as possible
- scanning for vulnerabilities at the last responsible moment (before deployment)
- restricting access to production ecosystem from the delivery system (pull new artifacts, don’t push)
But we also need to consider the security of the delivery system itself. Are we hardening the underlying infrastructure? Are we isolating and using minimal OS images on the build agents? Do we regularly recreate the underlying infrastructure not only as proof of disaster recovery, but also to eliminate potentially unauthorized access? Are critical activities in the pipeline protected by role-based access?
While we might not be able to address everything at once, the key is to keep security in mind. Start small but make security a key concern in the design and evolution of the delivery system.
4.11 Get started!
- Identify your software delivery system. What are all the tools, plugins, pipeline definitions, code repositories, and infrastructure required to deliver software today?
- Document your current and future practices. Take a step back to extract what are the key practices in your pipelines today, besides the traditional build-test-deploy. How are artifacts managed and retained? How is infrastructure provisioned? Do you create dynamic acceptance environments? Establish a baseline of what are critical practices today and start defining what are the desired practices to adopt.
- Adopt pipeline-as-code. Most CD tools now support configuring (YAML, JSON) or coding (Groovy, Java) all the steps and dependencies for any given pipeline. This relatively low effort step can dramatically increase predictability, ease bootstrapping of new pipelines, and scale new practices across multiple teams.
- Start moving to CI/CD infrastructure-as-code. If this infrastructure is still running on snowflake servers and/or agents, start by documenting it (most configuration management tools have utilities to reverse engineer a server) and then take small steps to automate a replica of that. Don’t go all in with any given tool, experiment a few and get a feeling for which best fits your requirements and skills.
- Start gathering core pipeline metrics. You don’t want to go crazy and start tracking all sorts of metrics. But there are core analytics you can quickly start measuring like cycle time, execution time for each activity, and, if possible, wait times (when you have manual steps in the pipeline). These will be building blocks for later analysis of trends and deviations.
4.12 Summary
The deployment pipeline and its tooling are an extension of your production system and require similar levels of product ownership, maintenance and product development. As with a customer facing product, there are tasks that you would not imagine skipping, such as using source control or monitoring server health, and this attention to detail needs to be extended to the pipeline too. The increased visibility and traceability will greatly improve the development and deployment experience and the focus on monitoring and logging will help keep the pipeline healthy and recover quickly from tooling issues.