Ultrasonic Distance Measurement
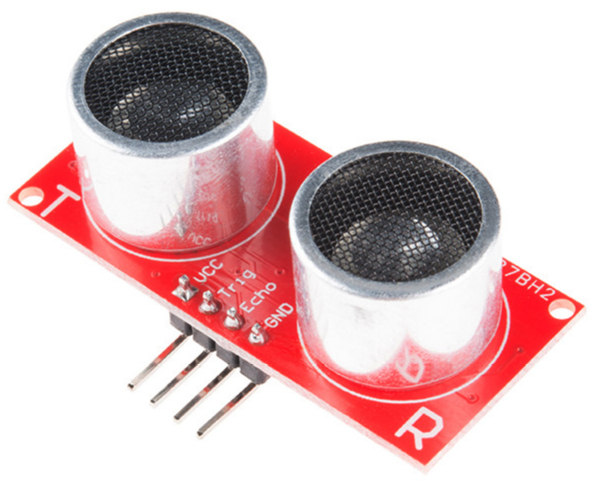
This project will measure distance using an ultrasonic sensor module. We will use the JSN-SR04T sensor since it utilises a single waterproof send/receive audio module that will be useful for my particular application, but an alternative sensor called the HC-SR04 is a drop in replacement that combines the electronic and audio modules. It also breaks out the send and receive components which allows for measuring closer distances down to 2cm.
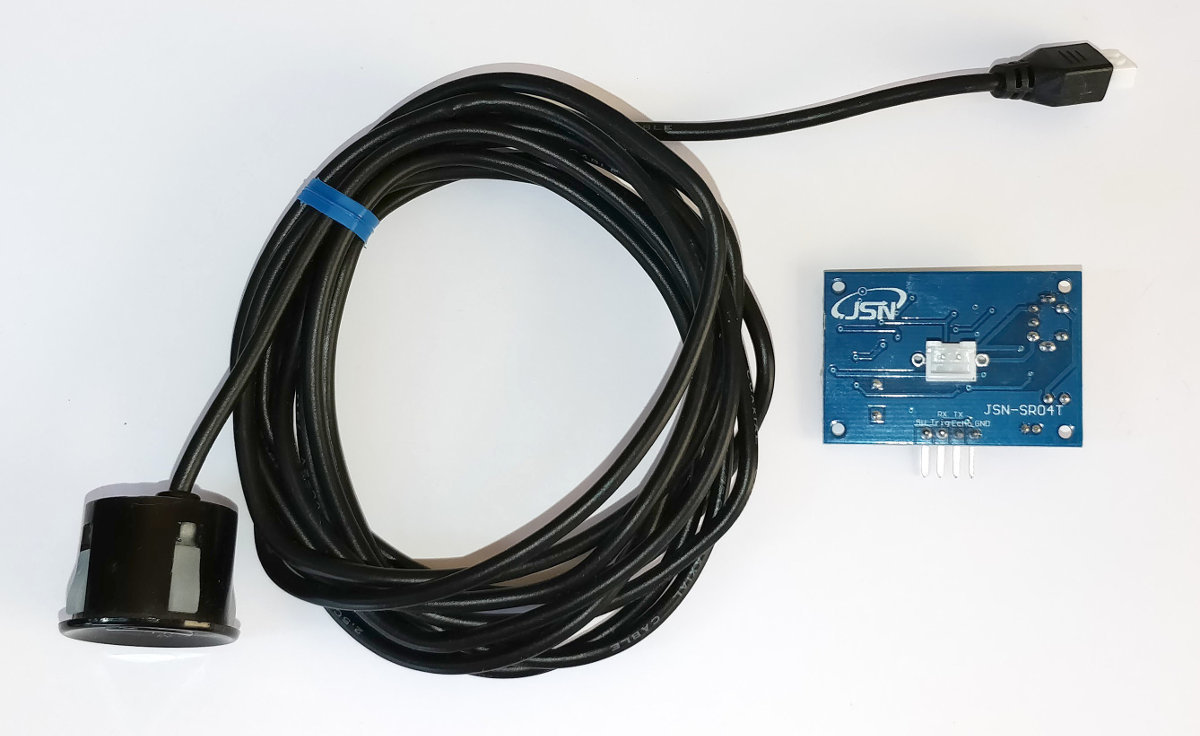
The JSN-SR04T Sensor
The JSN-SR04T is an ultrasonic ranging sensor that comprises an electronics module and a waterproof audio module connected by a long cable. It is designed to measure distance by sending out a high frequency pattern of pulses when triggered and to return a signal that corresponds to the length of time that it has taken for the pulses to travel out and be reflected back to the audio module.
JSN-SR04T Specifications
Specifications:
- Operating voltage: DC 5V
- Quiescent current: 5mA
- Total current work: 30mA
- Acoustic emission frequency: 40khz
- Farthest distance: 4.5m
- Shortest distance: 25cm
- Module size: 41mm x 28.5mm
- Resolution: about 0.5cm
- Angle: less than 50 degrees
- Working temperature: -10 to 70°C
Wiring:
- +5V (Power supply)
- Trig (Receives the trigger to operate)
- Echo (Signals time taken for audio send/receive trip)
- GND (Ground)
The device is touted as a drop-in replacement for the HC-SR04 which combines the electronics and audio modules and which separates the transmit and receive sensors.
Measure
Hardware required
- 1 x JSN-SR04T sensor
- 1k Ohm resister
- 2k Ohm resister
- Jumper cables with Dupont connectors on the end
- Solder
- Heat-shrink
Connect
For the sake of keeping the connecting pins together on the Pi’s GPIO block we will be connecting pins 4,6,8 and 10 to the JSN-SR04T electronics module. The following diagram provides a high level overview of the complete chain.
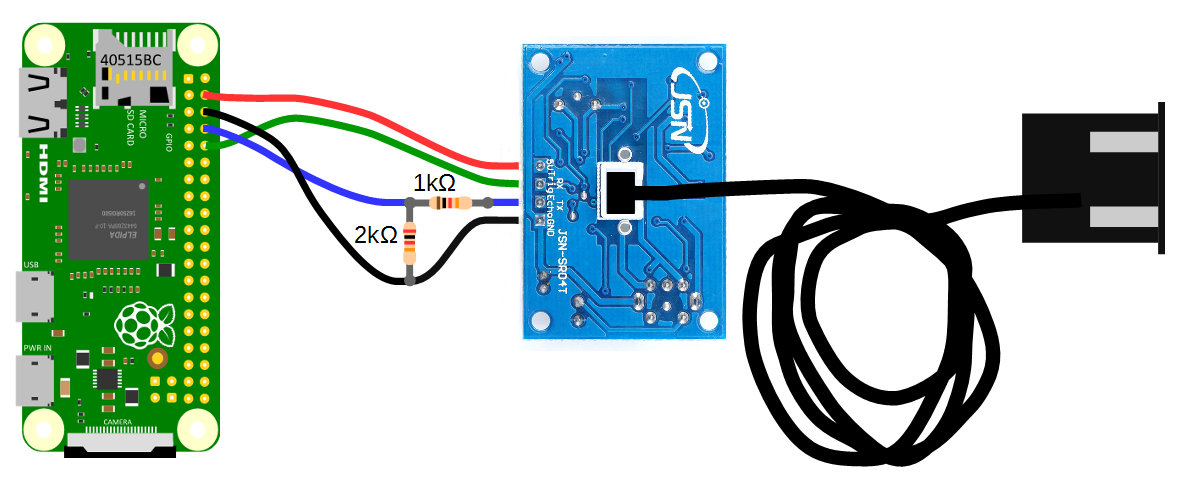
- Pin 4 connects directly to the +5V connector
- Pin 6 Connects directly to the GND connector, but is incorporated into the voltage divider for the Echo pin.
- Pin 8 connects to the centre of the voltage divider
- Pin 10 connects directly to the Trig connector.
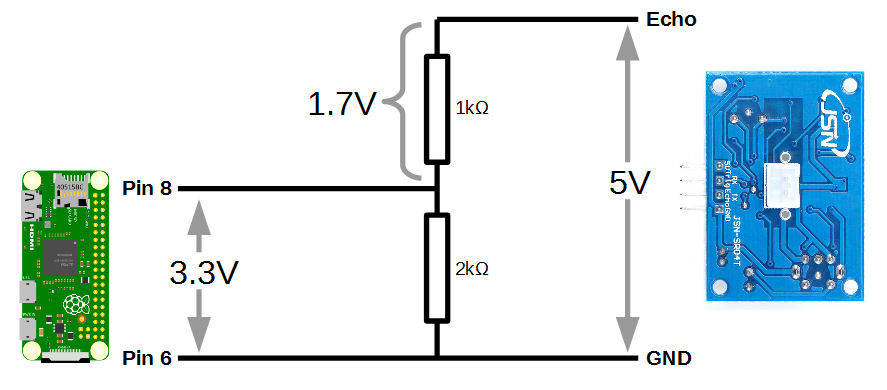
As we noted earlier, the Raspberry Pi provides general purpose digital input/output pins (called GPIO pins) that you can use for reading digital logic signals. In our case, we will want to apply the output signal from the ‘Echo’ pin to them. Unfortunately the output voltage from the Echo pin is 5V and the GPIO pins on the Raspberry Pi are only able to operate safely at voltage levels of 3.3V.
To safely apply the correct voltage to the Pi we can employ a voltage divider which divides the signal in a ratio corresponding to the resistance of two connected resistors. In the following diagram we can see that when a 5V signal is applied from the JSN-SR04T, 1.7V is dropped across the 1k Ohm resistor and 3.3V is across the 2k Ohm resistor.
Basic Operation
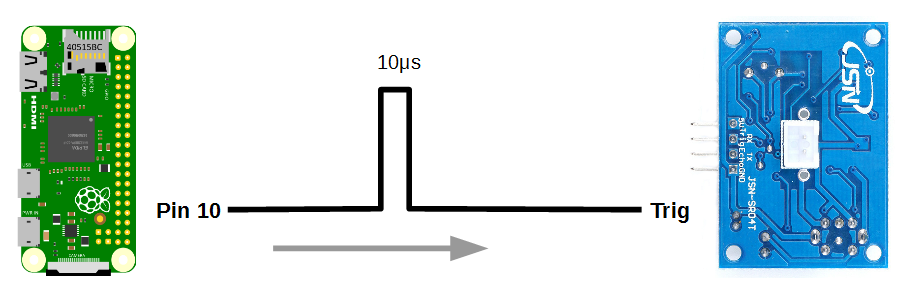
A pulse of at least 10us is applied to the trigger (Trig) pin of the electronics module.
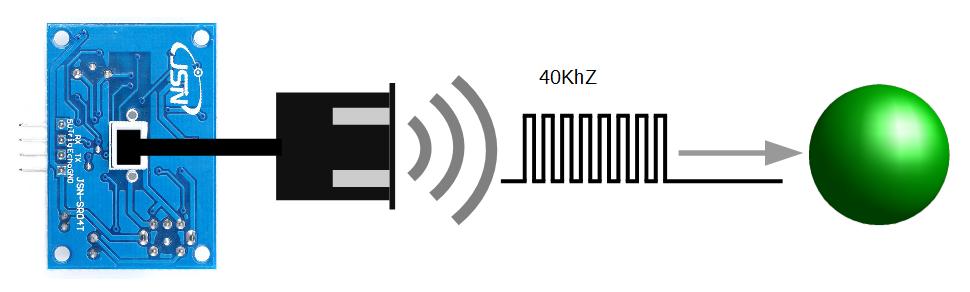
This will automatically generate 8 audio pulses at 40kHz from the audio transmitter / receiver module.
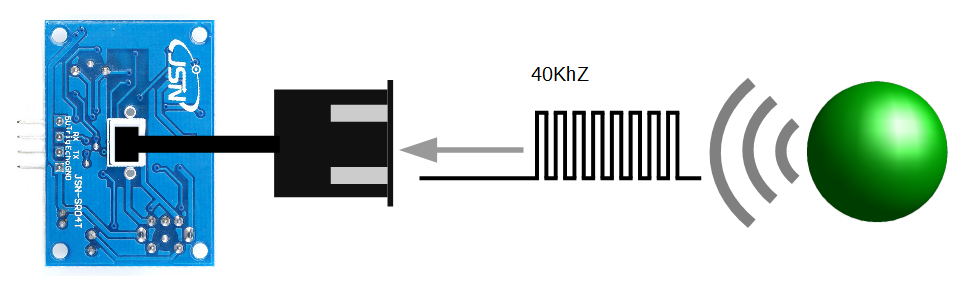
The 8 pulses will reflect off a surface and be received back at the audio module.
The electronics module will generate a signal from the Echo pin that corresponds to the time between the audio pulses being transmitted and the reflections being received. If no reflected audio is received, a signal of time, t = 38ms will be generated.
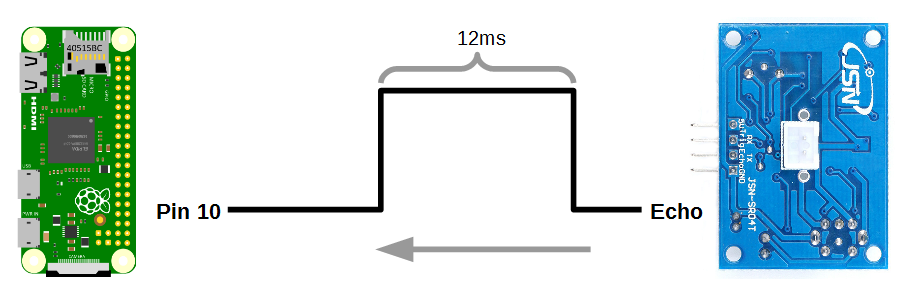
The distance from the audio module to the reflecting surface can be found by multiplying the time that the echo pin was high by the speed of sound (340m/s) and dividing by 2 (since the sound travelled out and back). In our case we have a singnal from the Echo pin of 12ms. Therefore;
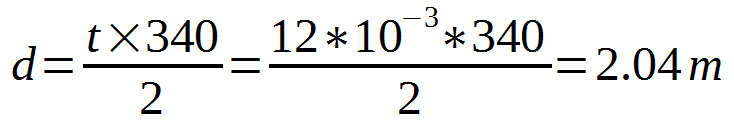
Our object is 2.04 metres away!
Test
The following python program can be saved onto our Pi as distance.py and run from the command line using;
#!/usr/bin/python
#encoding:utf-8

import RPi.GPIO as GPIO                    #Import GPIO library
import time                                #Import time library
GPIO.setmode(GPIO.BCM)                     #Set GPIO pin numbering

TRIG = 15                                  #Associate pin 15 to TRIG
ECHO = 14                                  #Associate pin 14 to Echo

print "Distance measurement in progress"

GPIO.setup(TRIG,GPIO.OUT)                  #Set pin as GPIO out
GPIO.setup(ECHO,GPIO.IN)                   #Set pin as GPIO in

while True:

  GPIO.output(TRIG, False)                 #Set TRIG as LOW
  print "Waiting For Sensor To Settle"
  time.sleep(2)                            #Delay of 2 seconds

  GPIO.output(TRIG, True)                  #Set TRIG as HIGH
  time.sleep(0.00001)                      #Delay of 0.00001 seconds
  GPIO.output(TRIG, False)                 #Set TRIG as LOW

  while GPIO.input(ECHO)==0:               #Check if Echo is LOW
    pulse_start = time.time()              #Time of the last  LOW pulse

  while GPIO.input(ECHO)==1:               #Check whether Echo is HIGH
    pulse_end = time.time()                #Time of the last HIGH pulse

  pulse_duration = pulse_end - pulse_start #pulse duration to a variable

  distance = pulse_duration * 17150        #Calculate distance
  distance = round(distance, 2)            #Round to two decimal points

  if distance > 20 and distance < 400:     #Is distance within range
    print "Distance:",distance - 0.5,"cm"  #Distance with calibration
  else:
    print "Out Of Range"                   #display out of range
This program is available from the code samples that can be downloaded with the book from Leanpub.
When executed the sensor will settle and then start displaying the distance every two seconds.
Move the audio module about and confirm that it is operating as expected.
Record
To record this data we will use a Python program that checks the sensor and writes the distance and the time into our database.
Our Python program will execute the program at a regular interval using cron which we used earlier to automatically reconnect to the network if required.
Code
The following Python code is a combination of our test code and one that simply writes the value for time and distance into our database.
The full code can be found in the code samples bundled with this book (distance-record.py).
#!/usr/bin/python
#encoding:utf-8

import RPi.GPIO as GPIO                  #Import GPIO library
import time                              #Import time library
import sqlite3                           #Import SQLite library
GPIO.setmode(GPIO.BCM)                   #Set GPIO pin numbering

TRIG = 15                                #Associate pin 15 to TRIG
ECHO = 14                                #Associate pin 14 to ECHO

print "Distance measurement in progress"

GPIO.setwarnings(False)
GPIO.setup(TRIG,GPIO.OUT)                #Set pin as GPIO out
GPIO.setup(ECHO,GPIO.IN)                 #Set pin as GPIO in


GPIO.output(TRIG, False)                 #Set TRIG as LOW
print "Waiting For Sensor To Settle"
time.sleep(5)                            #Delay of 5 seconds

GPIO.output(TRIG, True)                  #Set TRIG as HIGH
time.sleep(0.00001)                      #Delay of 0.00001 seconds
GPIO.output(TRIG, False)                 #Set TRIG as LOW

while GPIO.input(ECHO)==0:               #Is the ECHO LOW
  pulse_start = time.time()              #Saves last LOW pulse

while GPIO.input(ECHO)==1:               #Is the ECHO HIGH
  pulse_end = time.time()                #Saves last HIGH pulse

pulse_duration = pulse_end - pulse_start #Get pulse duration

distance = pulse_duration * 17150        #* by 17150 to get distance
distance = round(distance, 2)            #Round to two decimal points

if distance > 2 and distance < 400:      #Check whether is within range
  print "Distance:",distance - 0.5,"cm"  #print with 0.5 cm calibration
else:
  print "Out Of Range"                   #display out of range

# Get the time in the right format
dtg = time.strftime('%Y-%m-%d %H:%M:%S', time.localtime())+".000"
print "Local current time :", dtg

try:
    # Opens a file called measurements
    db = sqlite3.connect('/home/pi/measurements')
    # Get a cursor object
    cursor = db.cursor()
    # Insers the values into the table
    cursor.execute('''INSERT INTO distance(dtg, ultrasonic)
                  VALUES(?,?)''', (dtg,distance))
    # Commit the change
    db.commit()
# Catch any exception
except Exception as e:
    # Roll back any change if something goes horribly wrong
    db.rollback()
    raise e
finally:
    # Close the db connection
    db.close()
This script can be saved in our home directory (/home/pi) and can be run by typing;
The output should look something like this;
Run this script a few times and then we can check the results in our database by starting up SQLite as follows;
From the SQLite prompt we can query the database to return all the records using SELECT * FROM distance; as follows;
There are three records, including the times they were taken and the distances recorded.
Recording data on a regular basis with cron
As mentioned earlier, while our code is a thing of beauty, it only records a single entry for the distance every time it is run.
What we need to implement is a schedule so that at a regular time, the program is run. This is achieved using cron via the crontab.
To set up our schedule we need to edit the crontab file. This is is done using the following command;
Once run it will open the crontab in the nano editor. We want to add in an entry at the end of the file that looks like the following;
0 */1 * * * /usr/bin/python /home/pi/distance-record.py
This instructs the computer that at 0 minutes, every hour of every day of every month we run the command /usr/bin/python /home/pi/distance-record.py (which, if we were at the command line in the pi home directory, we would run as python distance-record.py, but since we can’t guarantee where we will be when running the script, we are supplying the full path to the python command and the distance-record.py script.
Save the file and when the next hour rolls over our program will run on its designated schedule and we will have distance entries written to our database every hour. After a while we can check it out by running a SELECT * FROM distance; on the measurement database.
Managing database size
While it’s a great idea to save our local data into a database, we stand the risk of gradually letting that database fill up until it exceeds the capacity of our storage.
In the case of the measurements that we are carrying out this will only really happen after a really long time. capturing some simple measurements every hour means in the scheme of things that’s about 9000 recordings per year.
However, let’s not let a triviality like practical matters get in the way of writing some more code to address a theoretical problem.
What we’re looking for is a script that will run on a repeating schedule and remove old records. Sound familiar? That’s a very similar process that we are doing when we record our data. A python script that is executed regularly by cron.
Here’s how we can do it.
The following python script (which we can name db-manage.py) opens our database, deletes any records older than two years, cleans up and exits.
#!/usr/bin/python
#encoding:utf-8

#Import SQLite library
import sqlite3

# Opens a database file called measurements
conn = sqlite3.connect('/home/pi/measurements', isolation_level=None)
db = conn.cursor()

# Delete any records that are older than 2 years
db.execute('DELETE FROM distance WHERE dtg<DATETIME("now","localtime", "-2 ye\
ars")')
# VACUUM the database to remove any unnecessary data
db.execute('VACUUM')

# Commit the changes to the database and close the connection
conn.commit()
conn.close
The file is available as db-manage.pyp and can be found in the code sample extras that can be downloaded with this book.
It’s a pretty simple script and we can schedule its operation by editing the crontab file like so;
We want to add in an entry at the end of the file that looks like the following;
1 0 */1 * * /usr/bin/python /home/pi/db-manage.py
This instructs the computer that at 1 minutes past the hour at midnight (hence the 0) on the 1st day of every month we run the command /usr/bin/python /home/pi/db-manage.py (which, if we were at the command line in the pi home directory, we would run as python db-manage.py, but since we can’t guarantee where we will be when running the script, we are supplying the full path to the python command and the db-manage.py script.
Save the file and every month our program will run on its designated schedule and will make sure to delete any records older than two years.
Explore
Simple data point API
The main mechanism for exploring and using our data is going to be via a simple data block returned from a http request.
What does all that actually mean?
That’s a good question. Ultimately we’re measuring something and we want to be able to communicate that measurement to an external service. That service could be another database somewhere or to a web page or to a system that will alert based on the value of the distance being within certain boundaries.
The very simplest way that we can do this is to present the data as the measured values when we ask for them in a web request. This could be thought of as a simplified form of an API (and I plan to make something more complicated in the future). I> Technically, ‘API’ stands for Application Programming Interface. Think of it as a software program that allows a consistent transfer of information between two computers.
The data will be presented as JSON as that is one of the most ubiquitous data forms around.
Enough esoterics, what does the magic code look like that will do this?
<?php

$db = new PDO('sqlite://home/pi/measurements');

$result = $db->query('SELECT * FROM distance ORDER BY dtg DESC LIMIT 1');

$datapie = array();

$result->setFetchMode(PDO::FETCH_ASSOC);

while ($row = $result->fetch()) {
    extract($row);
    echo json_encode($row);
}

?>
We can save this file as distance.php and have it in the /var/www/html directory on our Pi (distance.php can be found in the code sample extras that can be downloaded with this book).
How we can put in the IP address of our Pi to our browser along with our distance php file (http://10.1.1.160/distance.php) and we should get something like the following appear in the browser;
What good will getting this data be? Well……. I’m a bit of a believer that the information that gets captured by the Pi shouldn’t ultimately reside on the device in the long term. In the perfect world I would see it being requested by an external service that was checking a range of data points that would exist around the home (temperature inside / outside, CO2 levels, is the car parked in the garage, that sort of thing) so this is more of an enabling device than a ‘let’s display stuff’ deal. But I hear what you’re saying. “That’s lame. How can I impress people with that?”. Fair point. To deal with that problem let’s make a simple graph.
Extracting a Range of Data
Righto… If we’re going to make a graph of our distances we’ll need a variation of our API that will gather and present a range of data that our graph can then display.
This will form a piece of code that our graph will use as a JSON formatted data source.
It will look as follows;
<?php

$data= array();

// connect to the database
$db = new PDO("sqlite://home/pi/measurements");
$db->setAttribute(PDO::ATTR_ERRMODE, PDO::ERRMODE_EXCEPTION);

// prepare SQL command and execute
$query = "SELECT * FROM distance WHERE
          dtg>DATETIME('now','localtime', '-14 days')";
$result = $db->prepare( $query );
$result->execute();

// compile the returned data
$values = $result->fetchAll(PDO::FETCH_ASSOC);
array_push($data, $values);

// print the data
echo json_encode($values);

// close the database connection
$db = NULL;

?>
This block of PHP code will connect to our database and instead of returning a single piece of data it will return (‘echo’) a range of values from the past 14 days. We’ll call the file distance-range.php and it will be in the /var/www/html directory. A copy of the file can be found in the code sample extras that can be downloaded with this book.
The following file is our graph which will use our distance-range.php file and display it. It uses the d3.js visualisation library and for a full description of the workings of the code please feel free to consult a copy of ‘D3 Tips and Tricks v4.x’. It’s free and can be downloaded from here.
<!DOCTYPE html>
<meta charset="utf-8">
<style> /* set the CSS */

.line {
  fill: none;
  stroke: steelblue;
  stroke-width: 2px;
}

</style>
<body>

<!-- load the d3.js library -->
<script src="https://d3js.org/d3.v4.min.js"></script>
<script>

// set the dimensions and margins of the graph
var margin = {top: 20, right: 20, bottom: 30, left: 50},
    width = 960 - margin.left - margin.right,
    height = 500 - margin.top - margin.bottom;

// parse the date / time
var parseTime = d3.timeParse("%Y-%m-%d %H:%M:%S.000");

// set the ranges
var x = d3.scaleTime().range([0, width]);
var y = d3.scaleLinear().range([height, 0]);

// define the line
var valueline = d3.line()
    .curve(d3.curveBasis)
    .x(function(d) { return x(d.date); })
    .y(function(d) { return y(d.close); });

// append the svg obgect to the body of the page
// appends a 'group' element to 'svg'
// moves the 'group' element to the top left margin
var svg = d3.select("body").append("svg")
    .attr("width", width + margin.left + margin.right)
    .attr("height", height + margin.top + margin.bottom)
  .append("g")
    .attr("transform",
          "translate(" + margin.left + "," + margin.top + ")");

// Get the data
d3.json("distance-range.php", function(error, data) {
  if (error) throw error;

  // format the data
  data.forEach(function(d) {
      d.date = parseTime(d.dtg);
      d.close = +d.ultrasonic;
  });

  // Scale the range of the data
  x.domain(d3.extent(data, function(d) { return d.date; }));
  y.domain([0, d3.max(data, function(d) { return d.close; })]);

  // Add the valueline path.
  svg.append("path")
      .data([data])
      .attr("class", "line")
      .attr("d", valueline);

  // Add the X Axis
  svg.append("g")
      .attr("transform", "translate(0," + height + ")")
      .call(d3.axisBottom(x));

  // Add the Y Axis
  svg.append("g")
      .call(d3.axisLeft(y));

});

</script>
</body>
We will want to place a copy of this file which we will call distance-graph.html in the /var/www/html directory. A copy of it can be found in the code sample extras that can be downloaded with this book.
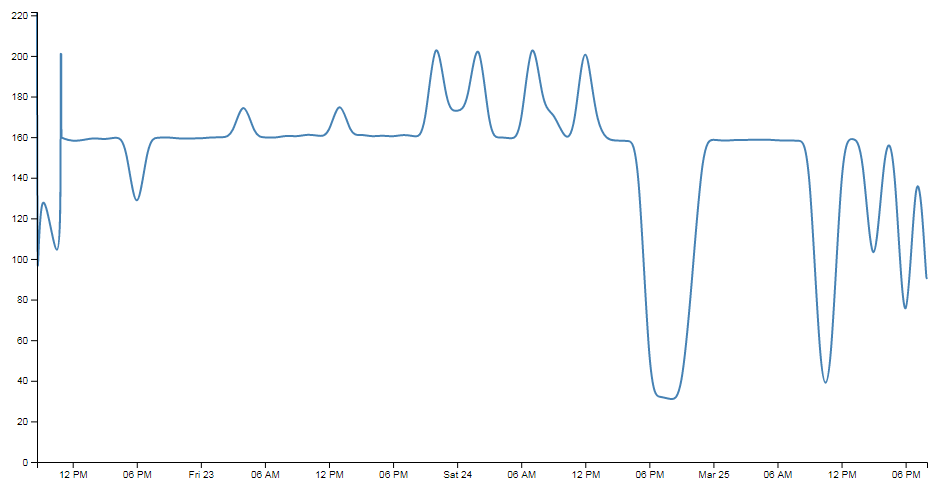
We can see the end result by putting the web address into our browser. It should look something like http://10.1.1.160/distance-graph.html. The end result should look a bit like the following;
Wrap Up
There we have it.
We’ve assembled our Raspberry Pi with an ultrasonic sensor, installed an operating system and configured it for use. We’ve set up networking and installed a database and a web server. We’ve written code to record data into our database and an API to pull data out of it. We’ve even installed a graph to display it in a visual form. Nice work.
There is a strong possibility that the information I have laid out here could be rife with evil practices and gross inaccuracies.
But look on the bright side. Irrespective of the nastiness of the way that any of it was accomplished or the inelegance of the code, if the picture drawn on the screen is relatively pretty, you can walk away with a smile. :-)
Those with a smattering of knowledge of any of the topics I have butchered above (or below) are fully justified in feeling a large degree of righteous indignation. To those I say, please feel free to amend where practical and possible, but please bear in mind this was written from the point of view of someone with only a little experience in the topic and therefore try to keep any instructions at a level where a new entrant can step in.