Chapter 2: The Cone of Uncertainty
You may have come across something called the “cone of uncertainty”.
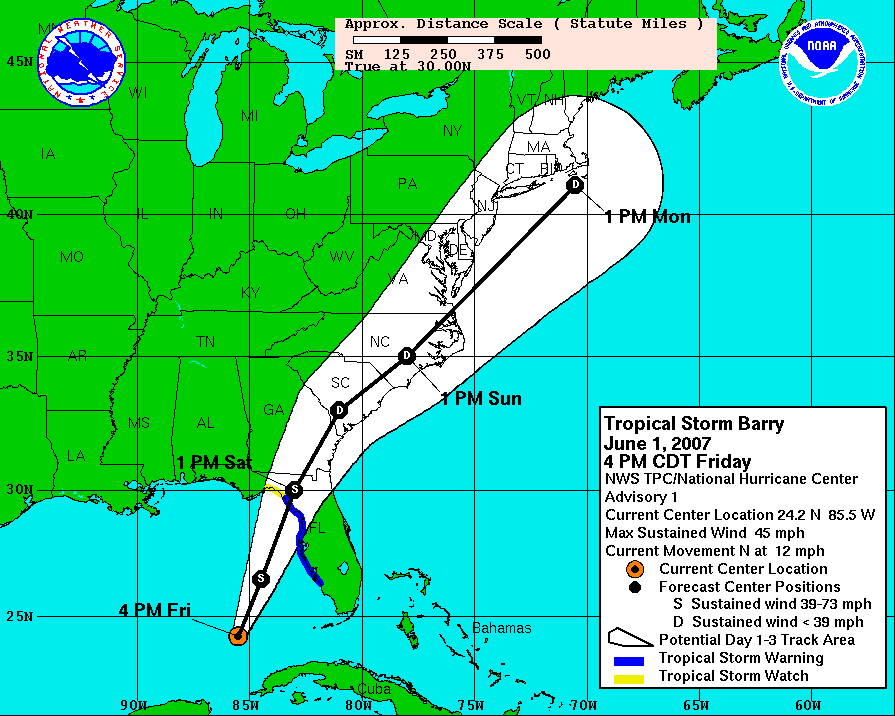
There are several graphics out there called that. The one with the widest recognition is probably the one used to model the future paths of hurricanes.
A more obscure one is the “binomial tree” used in the theory of financial options.
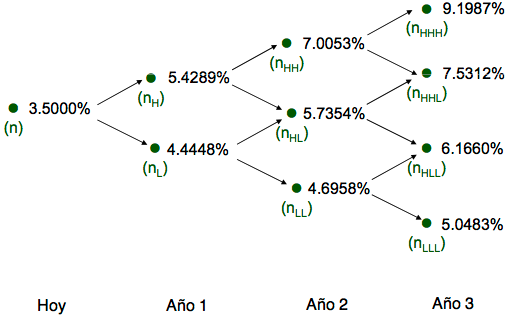
In both cases this is diagrammed from a present-time perspective, with the cone widening toward the future. We have some certainty about what is going to happen a few seconds from now - in all likelihood it will be whatever is happening now, more or less. And the further into the future we try to peek, the murkier it becomes.
What we’re going to discuss - and what has come to be accepted as one of the “well known truths” of software engineering, more specifically of software project management, is the following “inverted” cone, popularized by Steve McConnell after a diagram originally from Barry Boehm.
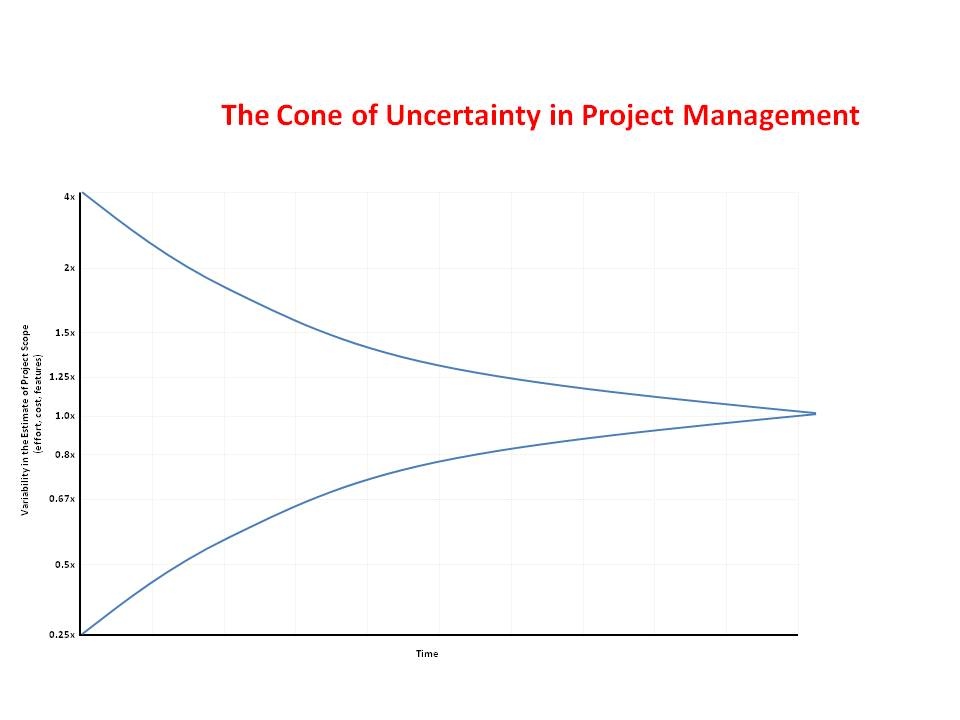
This is diagrammed from a future-time perspective, and shows uncertainty as a symmetrically widening range as we move further toward the present, which (given the usual convention for diagrams with a time axis) is on the left of the figure.
How to feel foolish in front of a class
The diagram became well-known when it was published in Steve McConnell’s “Rapid Software Development”, in 1996. McConnell cites a 1995 Boehm article as the source, but the diagram can in fact be found as early as 1981 in Boehm’s famous book “Software Engineering Economics”.
McConnell’s book is where I first came across the Cone, and it struck me as entirely plausible. I started using it to illustrate the perils of project planning. I distinctly remember one particular occasion when I was instructing a group of software engineers on the topic of “agile planning”, and I started drawing a picture of the cone of uncertainty.
And I stopped dead in my tracks.
Because I’d just realized I hadn’t the foggiest idea what I was talking about, or how I’d know if it made sense. I was just parroting something I’d read somewhere, and for once trying to explain it wasn’t helping me understand it better, it was just making me confused. And all I wanted to say anyway was “don’t trust estimates made at the beginning of a project”.
Making sense of the picture
What is odd, to any experienced software engineer, is that the Cone diagram is symmetrical, meaning that it is equally possible for an early estimate to be an over-estimate or an under-estimate. This does not really square with widespread experience of software projects, which are much more often late than they are early.
If you think a little about it, it can get quite puzzling what the diagram is supposed to mean, what each of its data points represents. A narrative interpretation goes like this: “very early in the project, if you try to estimate how long it will take, you’re likely to end up anywhere within a factor of 4 of what the project will eventually end up costing”. So a 1-year project can be estimated as a 3-month project early on, or as a 4-year project. Even after writing a first cut of requirements, a 1-year project can be estimated as a 6-month project or as a 2-year project.
It’s not clear that this latter case it at all common: a project that has reached this phase will in general take at least as long as has been planned for it, an instance of Parkinson’s Law. The Cone suggests that the distribution of project completion times follows a well-behaved Gaussian. What the Cone also suggests is that the “traditional” project management activities help: “By the time you get a detailed requirements document the range of uncertainty narrows considerably.” And the Cone suggests that uncertainty inevitably narrows as a project nears its projected release date.
Widespread experience, contradicts this. Many projects and tasks remain in the “90% done” state for a very long time. So if you wanted a diagram that truly represented how awful overall project estimation can be, you would need something that represented the idea of a project that was supposed to be delivered next year, for 15 years in a row. (Yes, I’m talking about Duke Nukem Forever.)
Getting to the facts
Boehm’s book is strongly associated with “waterfall” style project management, so for a long while I resisted getting the book; I’d verified earlier by looking at a borrowed copy that the diagram was indeed there, but I wasn’t really interested in digging further.
What I seemed to remember from that brief skim was that the diagram arose from research Boehm had done at TRW while building his large quantitative database which forms the basis for the COCOMO cost-modeling framework, and which is the book’s main topic.
I assumed that the diagram was the “envelope” of a cluster of data points obtained by comparing project estimates made at various times with actuals: some of these points would fall within the Cone, but the ones farthest from the original axis would draw the shape of the Cone if you “connected” the dots.
After seeing the Cone turn up in blog post after blog post, for a number of years, I finally broke down and ordered my own copy. When it arrived I eagerly turned to p.311, where the diagram is discussed.
And found a footnote that I missed the first time around:
These ranges have been determined subjectively, and are intended to represent 80% confidence limits, that is ‘within a factor of four on either side, 80% of the time’.
Emphasis mine: the word “subjectively” jumped out at me. This puzzled me, as I’d always thought that the Cone was drawn from empirical data. But no. It’s strictly Boehm’s gut feel - at least that’s what it’s presented as in the 1981 book.
The telephone game in action
And then I chanced across this bit from a bibliography on estimation from the website of Construx (Steve McConnell’s company):
Laranjeira, Luiz. ‘Software Size Estimation of Object-Oriented Systems,’ IEEE Transactions on Software Engineering, May 1990. This paper provided a theoretical research foundation for the empirical observation of the Cone of Uncertainty.
Wait a minute. What empirical observation?
Curious, I downloaded and read the 1990 paper. Its first three words are “the software crisis”. (For a software engineering leprechaun-doubter, that’s a very inauspicious start; the “crisis” being itself a software engineering myth of epic proportion - possibly the founding myth of software engineering. We’ll come back to that in a later chapter.)
The fun part is this bit, on page 5 of the paper:
Boehm studied the uncertainty in software project cost estimates as a function of the life cycle phase of a product. The graphic in Fig. 2 shows the result of this study, which was empirically validated (3, Section 21.1)
The reference in parentheses is to the 1981 book - in fact precisely to the section I’d just read moments before. Laranjeira, too, takes Boehm’s “subjective” results to be empirical! (And “validated”, even.)
Laranjeira then proceeds to do something that I found quite amazing: he interprets Boehm’s curve mathematically - as a symmetrical exponential decay curve - and, given this interpretation plus some highly dubious assumptions about object-oriented programming, works out a table of how much up-front OO design one needs to do before narrowing down the “cone” to a desired level of certainty about the schedule. Of course this is all castles in the air: no evidence as foundation.
Even funnier is this bit from McConnell’s 1996 book “Rapid Software Development”:
Research by Luiz Laranjeira suggests that the accuracy of the software estimate depends on the level of refinement of the software’s definition (Laranjeira 1990)
This doesn’t come right out and call Laranjeira’s paper “empirical”, but it is strongly implied if you don’t know the details. But that paper “suggests” nothing of the kind; it quite straightforwardly assumes it, and then goes on to attempt to derive something novel and interesting from it. (At least a couple later papers that I’ve come across tear Laranjeira’s apart for “gross” mathematical errors, so it’s not even clear that the attempt is at all successful.)
So, to recap: Boehm in 1981 is merely stating an opinion - but he draws a graph to illustrate it. At least three people - McConnell, Laranjeira and myself - fall into the trap of taking Boehm’s graph as empirically derived. And someone who came across McConnell’s later description of Laranjeira’s “research” should be forgiven for assuming it refers to empirical research, i.e. with actual data backing it.
But it’s leprechauns all the way down.
Controversy
In 2006 my friend and former colleague on the Agile Alliance board, Todd Little, published empirical data in IEEE Software that contradicted the Cone of Uncertainty. (Such data can be hard to come by, if only because it’s hard to know what “officially” counts as an estimate for the purposes of measuring accuracy Todd used the project manager’s estimates, included in project status reports).
Todd’s article immediately generated a controversy, which is precisely what we should expect if the Cone of Uncertainty belongs to the “folklore” category - it is a belief that is hard to let go of precisely because it has little empirical or conceptual backing. It has perceptual appeal, insofar as it supports a message that “estimation is hard”, but it also has very, very misleading aspects.
Apparently as a result of the controversy, and in a further departure from the original concept from Boehm, McConnell insisted strongly that the Cone “represented a best case” and that in fact, in addition to the Cone one should envision a Cloud of Uncertainty, shrouding estimates until the very end of the project. Metaphorically one “pushes” on the Cloud to get at something closer to the Cone.
By then though, that model has lost all connection with empirical data: it has become purely suggestive. It has no predictive power and is basically useless, except for the one very narrow purpose: providing an air of authority to “win” arguments against naive software managers. (The kind who insist on their teams committing to an estimate up front and being held accountable for the estimate even though too little is known.) But we should not be interested, at all, in winning arguments. We should be interested in what’s true and in what works.
The “Cone” isn’t really a good pictorial representation of the underlying concept that we want to get at, which is really a probability distribution. It has drifted loose from whatever empirical moorings it had thirty years ago.
What to make of all this?
First, that there is a “telephone game” flavor to this whole thing that is reminiscent of patterns we’ll see again, such as the claimed 10x variation between software developers’ productivity. One technical term for it is “information cascade”, where people take as true information that they should be suspicious of, not because they have any good reason to believe it but because they have seen others appear to believe it. This is, for obvious reasons, not conducive to good science.
Second, the distinction between empirical and conceptual science may not be clear enough in software engineering. Mostly that domain has consisted of the latter: conceptual work. There is a recent trend toward demanding a lot more empirical science, but I suspect this is something of a knee-jerk reaction to the vices of old, and may end up doing more harm than good: the problem is that software engineering seems bent on appropriating methods from medicine to cloak itself in an aura of legitimacy, rather than working out for itself methods that will reliably find insight.
Third, I wish my colleagues would stop quoting the “Cone of Uncertainty” as if it were something meaningful. It’s not. It’s just a picture which says no more than “the future is uncertain”, which we already know; but saying it with a picture conveys misleading connotations of authority and precision.
If you have things to say about software estimation, think them through for yourself, then say them in your own words. Don’t rely on borrowed authority.