2. Stories about change, stories in context: basic calculations

At its most basic, a spreadsheet acts as a calculator. They can add, subtract, divide, and multiply, and through a combination of those can calculate averages, proportions, rates, and various other things which can provide an insight into the data.
Calculations in Excel are normally referred to as formulae, and every formula begins with an equals sign:
=
This tells Excel that you are not directly entering information, but rather are expecting it to do some work.
After the equals sign comes the calculation. Try the following in any cell in an empty spreadsheet:
=15+145
As soon as you press Enter, the calculation is performed and the cell shows the result (160 hopefully).
Most of the time, however, Excel is used to perform calculations on values that are in cells elsewhere in the spreadsheet.
Cell references
Every cell in a spreadsheet has its own reference, based on the row and column it is in. The very first cell, for example, is in column A and row 1, which makes it cell A1 (the letter can be found above at the top of the column; the row number can be found to the far left).
The cell next to that in column B is B1, (different column, same row); and the cell underneath A1 is A2 (same column, different row).
If in doubt, you can find out the cell reference (the location of the cell - in this case A1) by selecting it and looking along the bar just above your column letters.

To the left of this bar is a box that shows you the cell reference, and after that is a longer box which shows what that cell has in it. That longer box is called the Formula bar.
Note that if the cell contains a formula, you will see the formula and not the results of the formula - which is what you see in the sheet itself.
These cell references make it possible to perform calculations on data in your sheet.
For example, try typing 15 in cell A1, and 145 in cell B1.
Now in cell C1, type the following:
=A1+B1
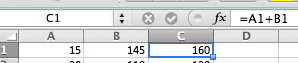
That formula adds whatever value is in A1, to whatever is in B1.
There are two advantages to this:
- If the value in A1 changes, your formula automatically re-calculates. Try it and see (make sure you press Enter after changing the value).
- If you have two or more columns of numbers and want to create a new column full of the same calculation for each row, it’s very easy to do so.
We’ll see the second in action in the next chapter.
Calculating a change
Before then, it’s worth exploring some commonly-used calculations you’ll need to tell stories from your data.
One of the most common of those stories is about change. Change is, almost by definition, newsworthy, and an integral part of storytelling. When things change, it makes the news.
But how big a change was it - and from what?
A calculation to find out how much something has changed is a straightforward subtraction:
What something is now MINUS what something was before.
For example: if this year there were 1000 assaults in Aberdeen, and last year there were 600, the calculation is:
1000-600
The result of that is 400. In other words, assaults have gone up by 400.
Sometimes you will get a negative result, which means something has dropped.
Let’s change our example to show that: this time let’s say this year there were 1000 assaults in Aberdeen, and last year there were actually 1100. Now the calculation is:
1000-1100
And the result is -100. In other words, assaults have gone down, by 100.
Unfortunately, when we look at change in terms of an absolute number: up by 400, or down by 100, that doesn’t tell us whether 400 or 100 is a lot, or not very much. And that’s when proportions come in handy.

Calculating a proportion
An equally common calculation used in stories about numbers is what proportion one thing is of another. Here are just a few examples:
- 95% of Birmingham events budget spent on Conservative Party Conference
- US spends 17.9% of its GDP on healthcare
- The most successful UK universities get 11% of their alumni to donate money
- Almost one in three criminals given treatment which involves speaking to their victims reoffend
Calculating a proportion is a simple division: dividing a part by the whole.
If the US spends $2.6 trillion on health, and its total GDP is $14.5 trillion, then to get the proportion above you divide 2,600,000,000,000 by 14,500,000,000,000.
The result is 0.179 (rounded down to three decimal places) - or 17.9%.
How is 0.179 the same as 17.9%? A useful approach is to think of it like this: 1 is the same as 100% - anything below 1 is a fraction of 1: 0.5 is half of 1; 0.25 is a quarter of 1; and so on.
0.5, then, can also be expressed as 50%, and 0.25 can be expressed as 25%.
To see those decimals as percentages we can do one of two things: either multiply them by 100 (0.5 x 100 = 50) to bring them to the other side of the decimal place, or simply change the formatting of the cell containing the result.
The latter is probably the better practice, as it retains the ‘true’ number and we can still perform calculations with it (100 times 50% is 50, for example, whereas 100 times 50 is 5000).
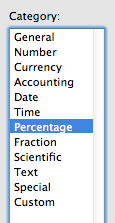
To do this, right click on the cell and select Format cells... - or use the keyboard shortcut CTRL+1. On the window that appears change the formatting to Percentage - you can also specify how detailed that percentage is.
Ratios: calculating a proportion as ‘1 in 10’
One of the examples above doesn’t present the proportion as a percentage, but rather a ratio: 1 in 3. This is a particularly clear way of presenting a proportion: it’s much easier for readers to visualise the proportion ‘one in three’ than the rather abstract figure of ‘33%’ (which you can get if you divide one by three - 0.33, or 33%).
So how do you express a percentage as a ratio? The most straightforward way is to look at the clear markers along the way.
For example:
- 0.05 is one in twenty (5%)
- 0.10 is one in ten (10%)
- 0.20 is one in five (20%)
- 0.25 is one in four - or a quarter (25%)
- 0.33 is one in three (33%)
- 0.40 is two in every five (40%)
- 0.5 is one in two (50%)
- 0.6 is three in every five (60%)
- 0.66 is two in every three (66%)
- 0.75 is three-quarters, or three in every four (75%)
- 0.8 is four out of every five (80%)
- 0.9 is nine out of every ten (90%)
- 0.95 is nineteen out of every twenty (95%)
Whatever your figure is, look at the proportion closest to it, and use that as a basis with the qualifier ‘more than’ or ‘almost’.
For example:
- 0.06 is ‘over one in twenty’
- 0.09 is ‘almost one in ten’
- 0.23 is ‘more than one in five’
- 0.27 is ‘over a quarter’
- 0.36 is ‘more than one in three’
- 0.39 is ‘just under two in every five’
- 0.49 is ‘almost half’
…and so on.
You can also use multipliers of some of the proportions in the main list: 0.15, for example, is three times ‘one in twenty’ and so could be expressed as ‘three in every twenty’ and 0.3 is ‘six in every twenty’.
The more you do this, the more it becomes second nature. Until then, keep the list above as a useful reminder.
Combining both: calculating what proportion a change is
So back to our change in assaults. Now we know how to calculate a proportion, we can calculate just how significant that rise of 400 assaults, or fall of 200, is.
The question is: what do we divide it by? The latest number, or the older one?
The answer lies in the way we would express it: ‘Assaults have risen’ or ‘assaults have fallen’. Implicit in that is this: ‘from what it used to be’.
So: you must divide your change by the original figure it has changed from
If assaults were 600 and have gone up to 1000, we need to work out how big a change that represents from the original figure of 600, i.e.
=400/600
The result is 0.66 - 66% higher, or two-thirds higher, than its previous figure.
The fall of 100 means a calculation like this:
=-100/1100
That’s -0.09, or a drop of 9% from its previous figure.
Now when it comes to increases you need to be very careful about your language. You might talk about something being 66% higher, but you can also talk about figures being 166% what they were (the 66% increase plus the original figure - 100%). Make sure you are clear yourself about what it is you are saying.
Beware also of confusing percent with percentage points: the latter is used more often in politics, where a party’s lead on a rival party might increase from 3% to 6% - that’s an increase of three percentage points but also a ‘doubling of their lead’. Try to avoid using “percentage points” outside of these very specific areas where usage has been better established, as they can cause confusion.
Another issue is whether you use the word ‘percent’ or the symbol ‘%’. If in doubt, check the style guides available online such as the APA grammar of percentage
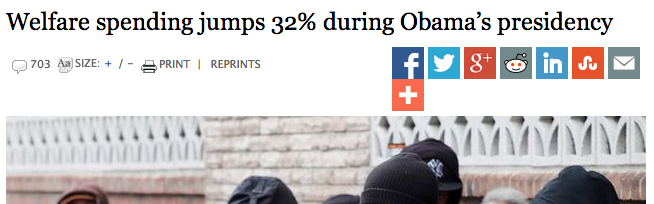
To see this process in practice, look at just one story in The Washington Times, ‘Welfare spending jumps 32% during Obama’s presidency‘. The numbers behind the headline are given low down in the article:
“Welfare spending as measured by obligations stood at $563 billion in fiscal year 2008, but reached $746 billion in fiscal year 2011, a jump of 32 percent.”
So, 746 minus 563 is 183. 183 divided by 563 (the starting figure) is 0.325 - or 32.5%.
Recap
- Calculations are called formulae in Excel and other spreadsheet software
- A formula begins with an equals operator like so:
= - Formulae can work with numbers or strings (indicated by quotation marks), but are most likely to use cell references like
A2orB300. - To calculate how much something has changed, take what something is now minus what it was before.
- To calculate what proportion the change represents, take that amount of change and divide it by the earlier figure (that it’s changed from).
- Try to express proportions as a ratio such as ‘almost one in ten’ or ‘over a quarter’ - often this is easier for the reader to take in and understand than a dry, precise percentage - unless the precision is important.
- Beware of confusing percent with percentage points - the latter is used much less and has a different meaning.